Fig. 19
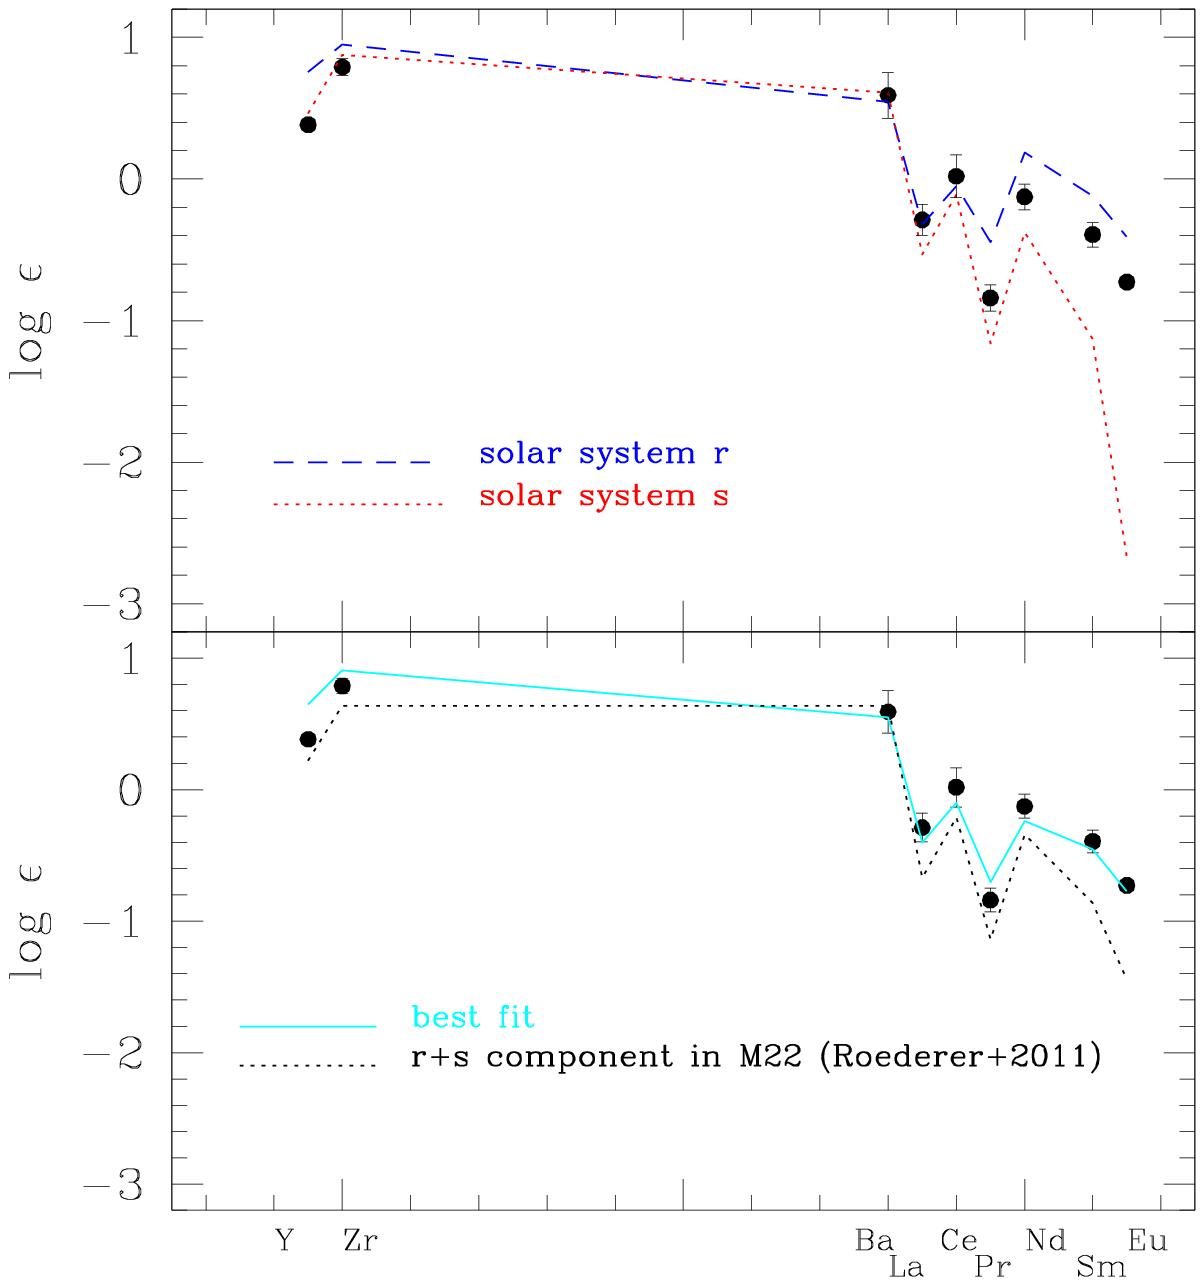
Average abundances of neutron-capture elements Y, Zr, Ba, La, Ce, Pr, Nd, Sm, and Eu in M 80. The associated rms scatters are also shown. In the upper panel, the solar scaled abundances of pure r-process (dashed line) and of pure s-process (dotted line) from Simmerer et al. (2004) are shown. In the lower panel, the attempt to best fit observed abundances with solar scaled pure r-process and s-process abundances (Simmerer et al. 2004) is shown (light blue line): the scaling factor adopted are −1.27 dex and −1.81 dex for the r- and s-process, respectively. The black dotted line connects the abundances in the r + s group of the GC M 22 derived by Roederer et al. (2011).
Current usage metrics show cumulative count of Article Views (full-text article views including HTML views, PDF and ePub downloads, according to the available data) and Abstracts Views on Vision4Press platform.
Data correspond to usage on the plateform after 2015. The current usage metrics is available 48-96 hours after online publication and is updated daily on week days.
Initial download of the metrics may take a while.