Fig. 14
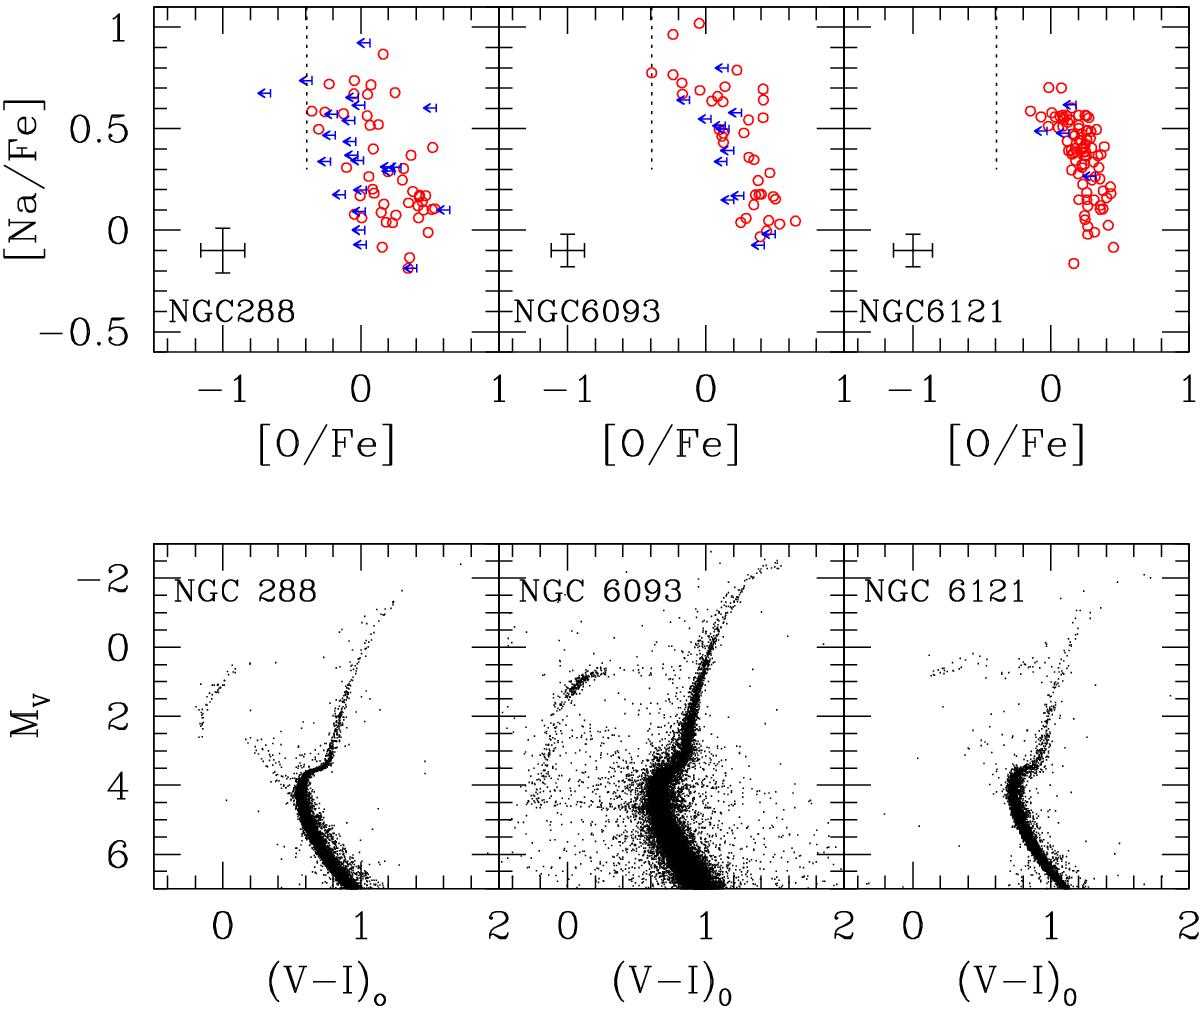
Upper panels, from left to right: Na-O anti-correlation for NGC 288 (Carretta et al. 2009a,b), M 80 (this work), and M 4 (NGC 6121, Carretta et al. 2009a,b). The vertical dotted line indicates the reach of the lowest [O/Fe] ratio measured in M 80, and it is superimposed to the two other GCs for comparison. Lower panels: MV vs. V − I CMDs for the three GCs from the ACS survey by Sarajedini et al. (2007). Distance moduli and reddening values are from Harris (1996).
Current usage metrics show cumulative count of Article Views (full-text article views including HTML views, PDF and ePub downloads, according to the available data) and Abstracts Views on Vision4Press platform.
Data correspond to usage on the plateform after 2015. The current usage metrics is available 48-96 hours after online publication and is updated daily on week days.
Initial download of the metrics may take a while.