Fig. 1
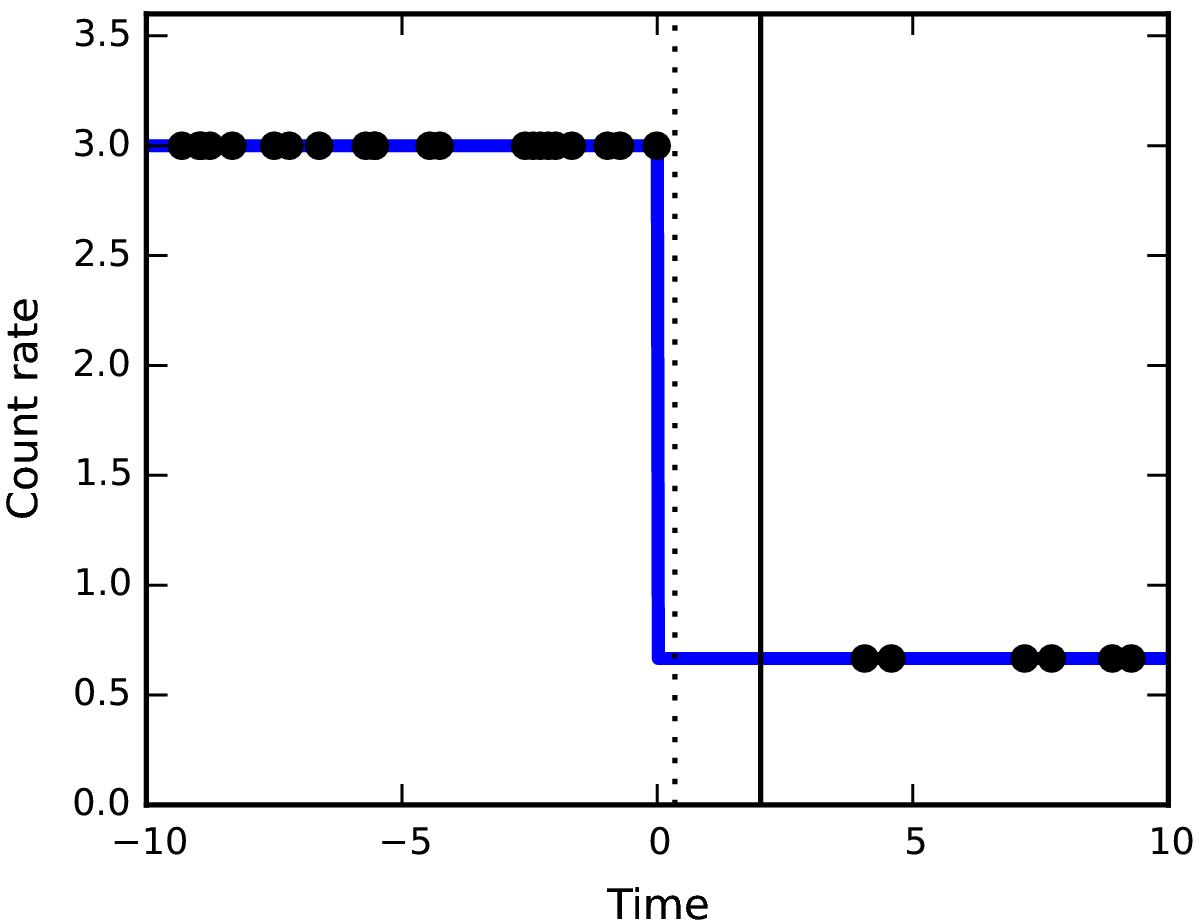
Illustration of the change point bias toward blocks with lower count rate. The two count rates, 3 and 2/3, are shown as the blue line, with events placed according to a Poisson process shown as circles. The half-way point between the two terminal photons is shown as a solid vertical line, while the change point placed according to Eq. (3)is shown as a vertical dotted line. It is clear that the half-way change point method is biased towards blocks with lower count rate, but that the adjusted change point location gives a better estimate of the true location of the change point.
Current usage metrics show cumulative count of Article Views (full-text article views including HTML views, PDF and ePub downloads, according to the available data) and Abstracts Views on Vision4Press platform.
Data correspond to usage on the plateform after 2015. The current usage metrics is available 48-96 hours after online publication and is updated daily on week days.
Initial download of the metrics may take a while.