Fig. 7
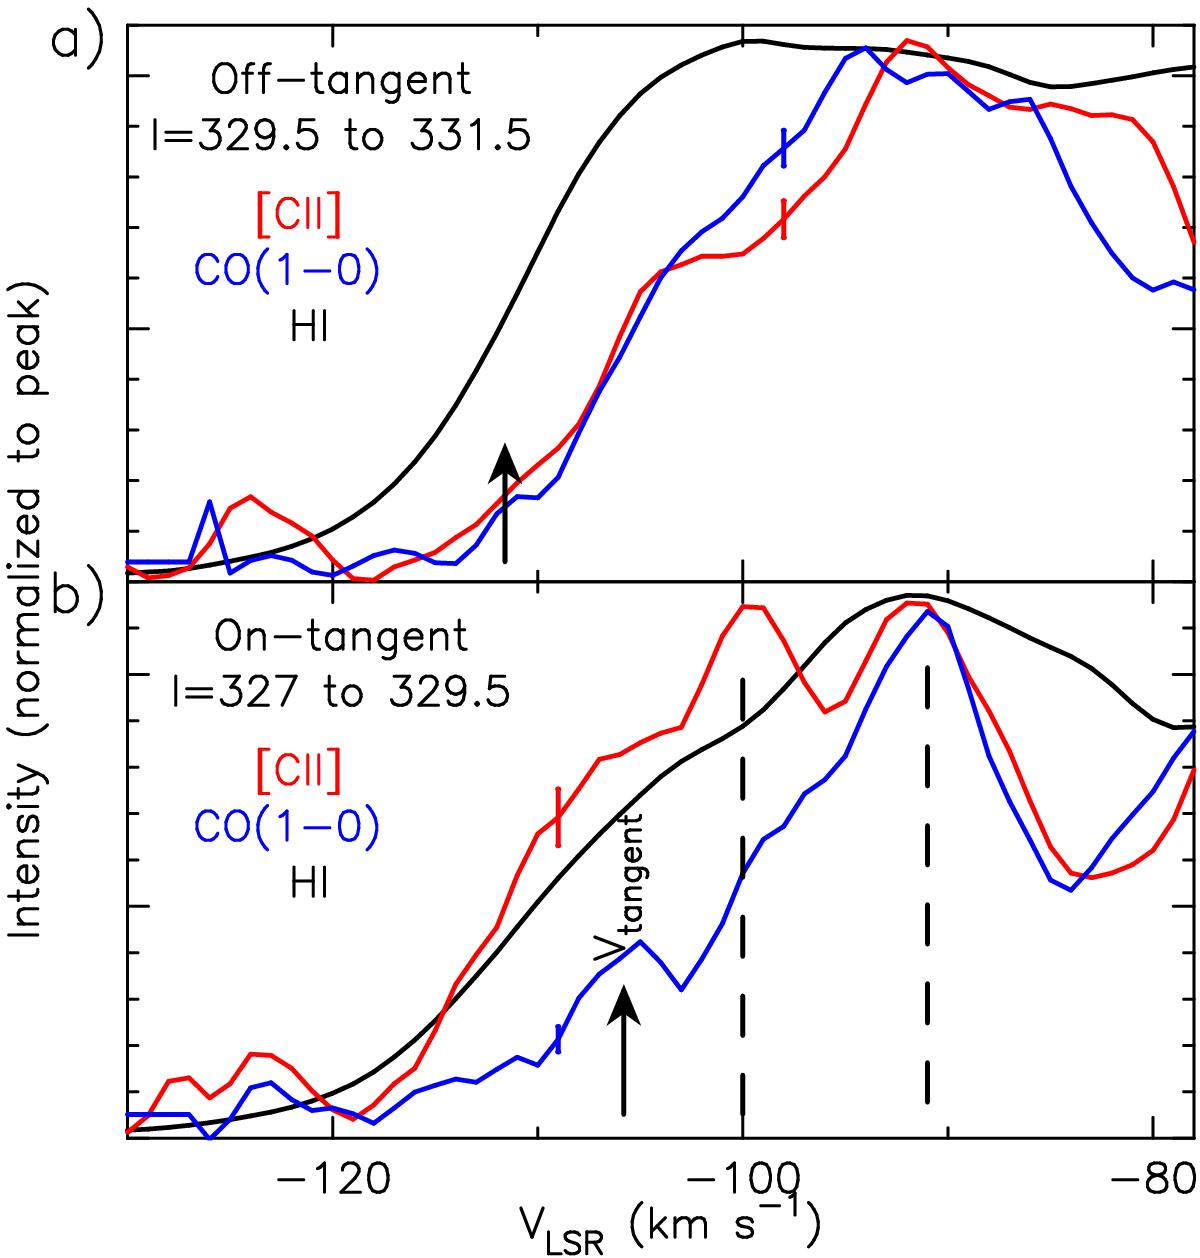
Norma tangency spectra. The [C ii], H i, and 12CO emission spectra are plotted against velocity (VLSR). Each panel shows the spectra for the indicated longitude ranges. Note that the intensity scale is normalized to the peak emission within the velocity range. The corresponding 1σ error bars are indicated on the [C ii] and 12CO spectra. The tangent velocity is marked on each panel by a vertical arrow. Panel a): Off-tangent. Panel b): On-tangent.The dashed lines indicate the VLSR shift between the [C ii] and 12CO peaks.
Current usage metrics show cumulative count of Article Views (full-text article views including HTML views, PDF and ePub downloads, according to the available data) and Abstracts Views on Vision4Press platform.
Data correspond to usage on the plateform after 2015. The current usage metrics is available 48-96 hours after online publication and is updated daily on week days.
Initial download of the metrics may take a while.