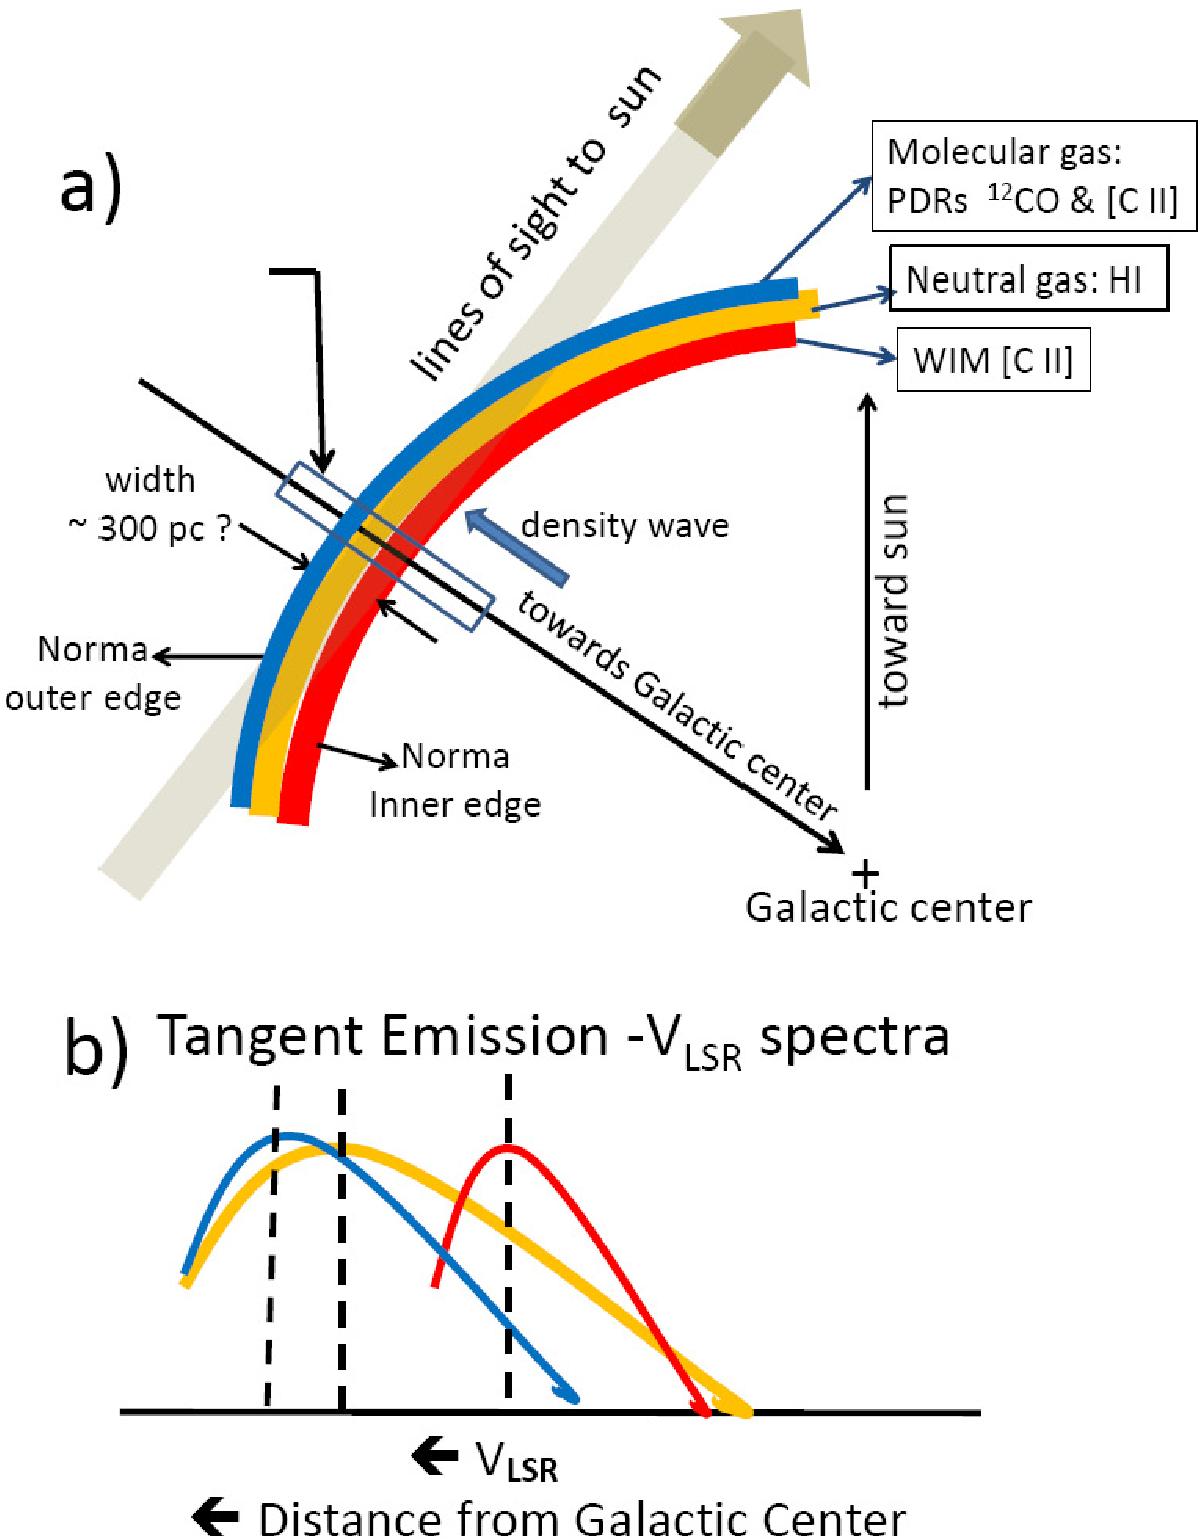
Fig. 6

a) Schematic view of the Norma spiral arm tangency. The emissions (distinguished by color) tracing the spiral arm are shown as a cross cut of the layers from the inner to outer edges (adapted from Figs. 2 and 3 in Vallée 2014a). b) A sketch indicating the velocity (VLSR) structure of the corresponding spectral line intensities near the tangency for each layer. Note that this cartoon is intended to be a schematic and is not to scale.
Current usage metrics show cumulative count of Article Views (full-text article views including HTML views, PDF and ePub downloads, according to the available data) and Abstracts Views on Vision4Press platform.
Data correspond to usage on the plateform after 2015. The current usage metrics is available 48-96 hours after online publication and is updated daily on week days.
Initial download of the metrics may take a while.


