Fig. 2
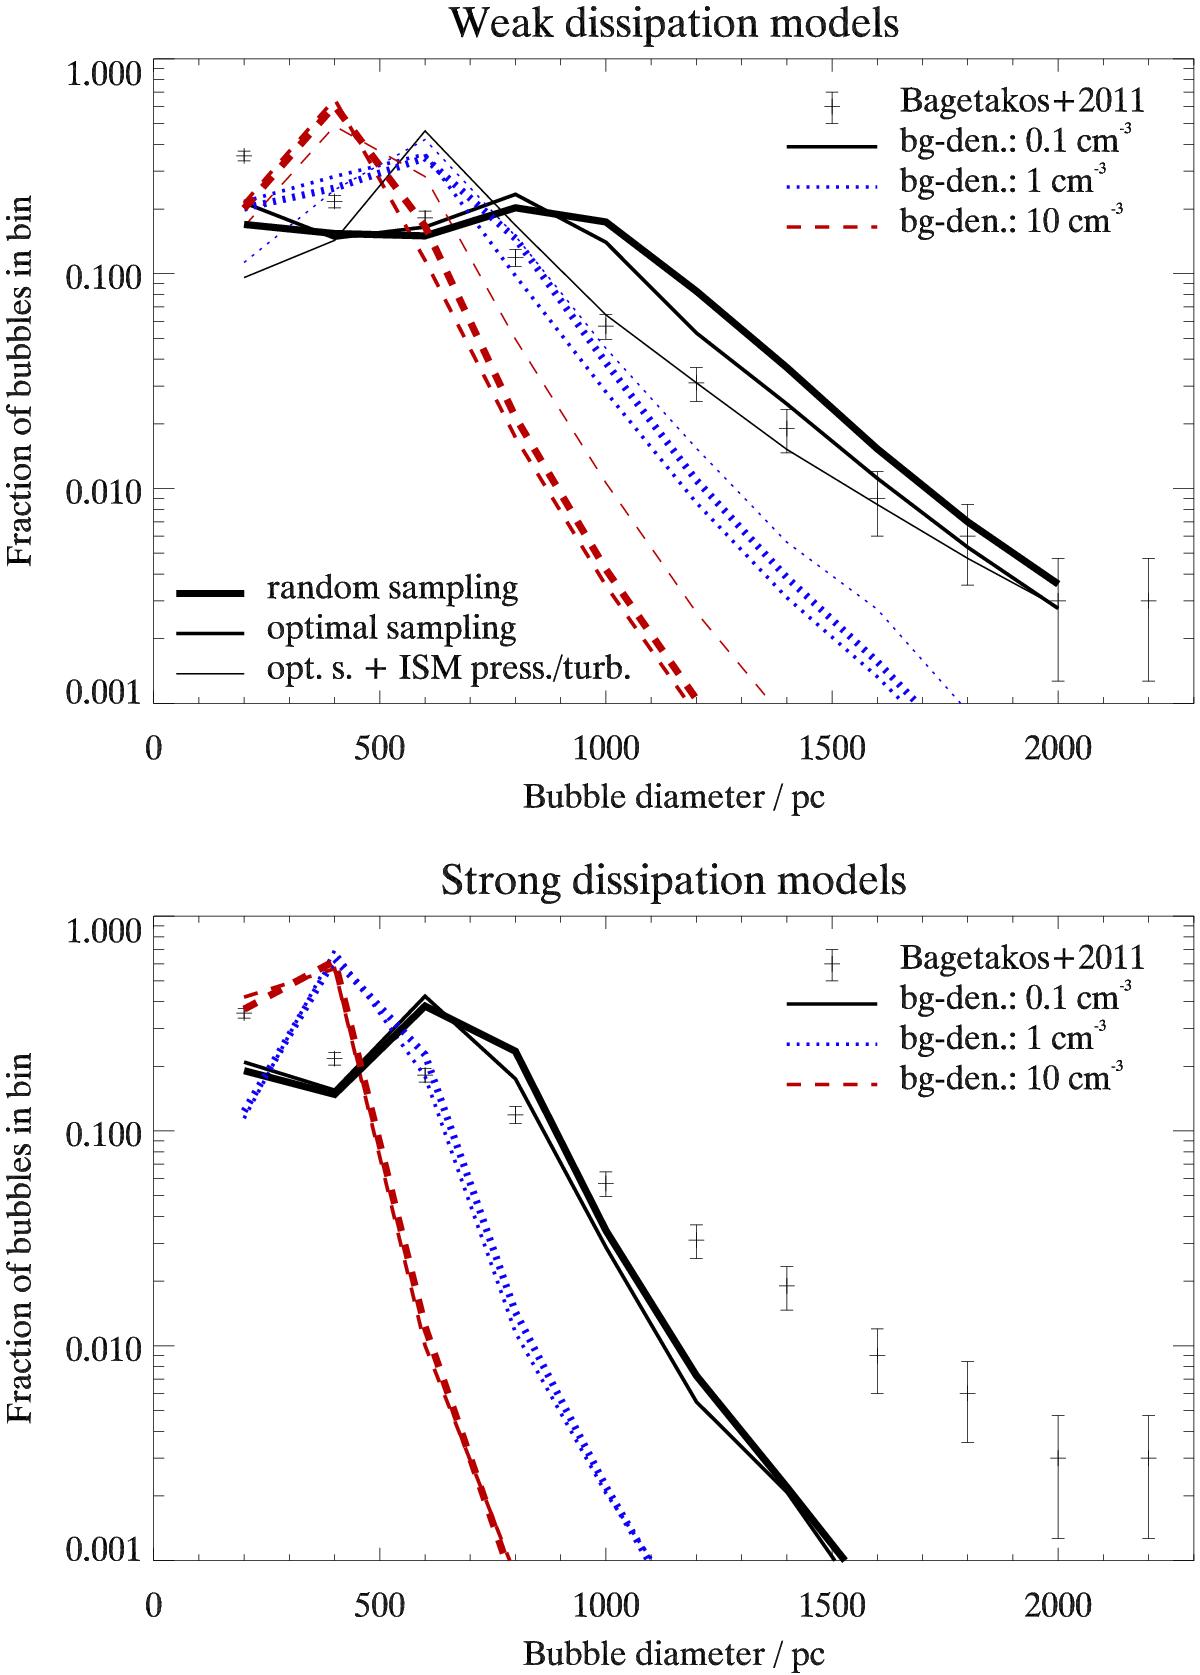
Superbubble diameter distributions for the weakly (top) and the strongly (bottom) dissipative model for three different choices of the background density (bg den. in the legends). The size of the bins is 200 pc. Thick lines are for random sampling, thinner lines for optimal sampling, and the thinnest lines in the top panel are for optimal sampling where the background pressure and superbubble destruction by ISM turbulence are taken into account. The minimum near 400 pc for the solid curves is due to the strong acceleration after the first supernova in a superbubble. It is below the data range for the other curves. Large superbubbles are better explained by the weakly dissipative model.
Current usage metrics show cumulative count of Article Views (full-text article views including HTML views, PDF and ePub downloads, according to the available data) and Abstracts Views on Vision4Press platform.
Data correspond to usage on the plateform after 2015. The current usage metrics is available 48-96 hours after online publication and is updated daily on week days.
Initial download of the metrics may take a while.