Fig. 1
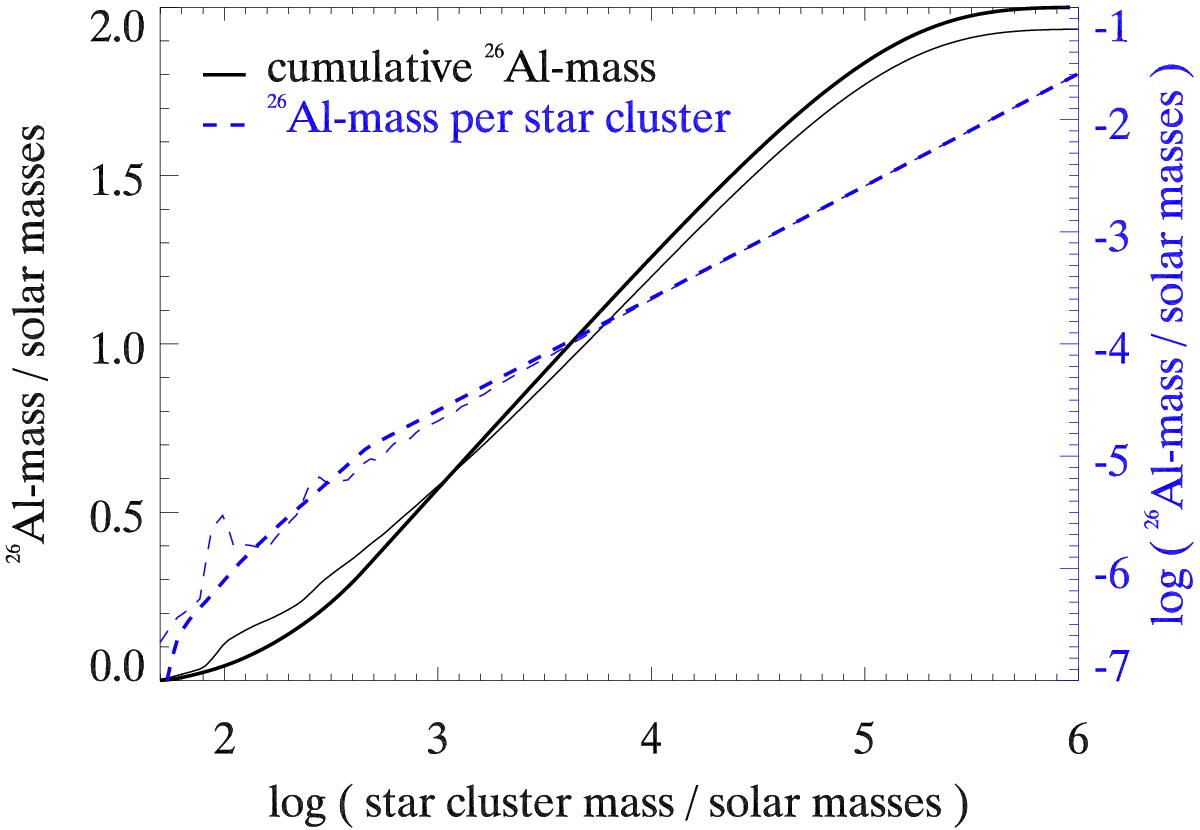
26Al mass for individual star clusters of given mass (dotted blue, right vertical scale) and cumulative 26Al mass for the Milky Way as a function of star cluster mass, assuming a star formation rate of 1.9 M⊙ yr-1 (solid black, left vertical scale). Thin (thick) lines are for the case of truncated IMFs (random sampling). In the limit of high star cluster masses, 2.6 × 10⁻⁸ M⊙ of 26Al is produced per unit stellar mass formed. The blue dashed curves are therefore linear, down to about 1000 M⊙, where sampling effects become important.
Current usage metrics show cumulative count of Article Views (full-text article views including HTML views, PDF and ePub downloads, according to the available data) and Abstracts Views on Vision4Press platform.
Data correspond to usage on the plateform after 2015. The current usage metrics is available 48-96 hours after online publication and is updated daily on week days.
Initial download of the metrics may take a while.