Fig. 8
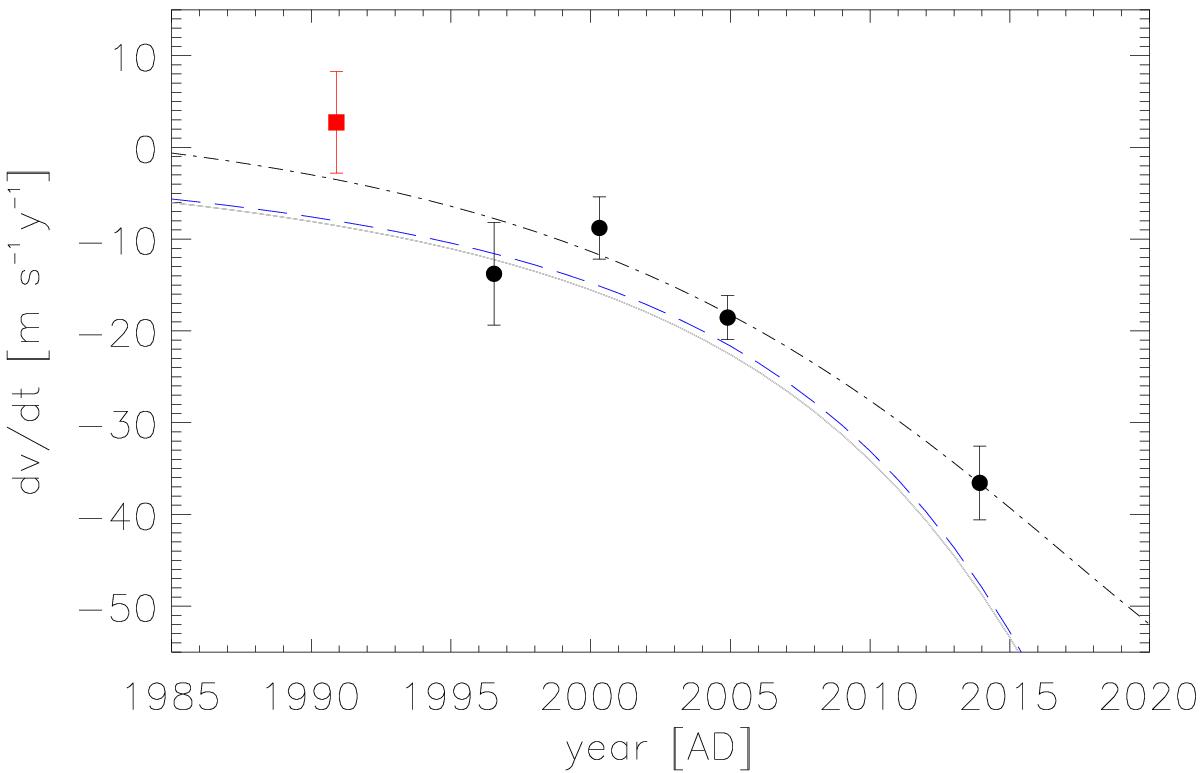
Points represent the values for the long-term RV slopes fitted on Lick and HARPS-N data. The red square is the value for the first Lick setup with large error bars, which was not taken in consideration when we fit the planetary parameters. The black dotted-dashed line represents the fitted orbit of the binary companion from the two-objects fit of Table 5. The blue dashed line is the long-term slope for the best-fit orbit for the stellar companion reported by Drummond (2014), assuming a mass value of 0.4 M⊙.
Current usage metrics show cumulative count of Article Views (full-text article views including HTML views, PDF and ePub downloads, according to the available data) and Abstracts Views on Vision4Press platform.
Data correspond to usage on the plateform after 2015. The current usage metrics is available 48-96 hours after online publication and is updated daily on week days.
Initial download of the metrics may take a while.