Free Access
Fig. 5
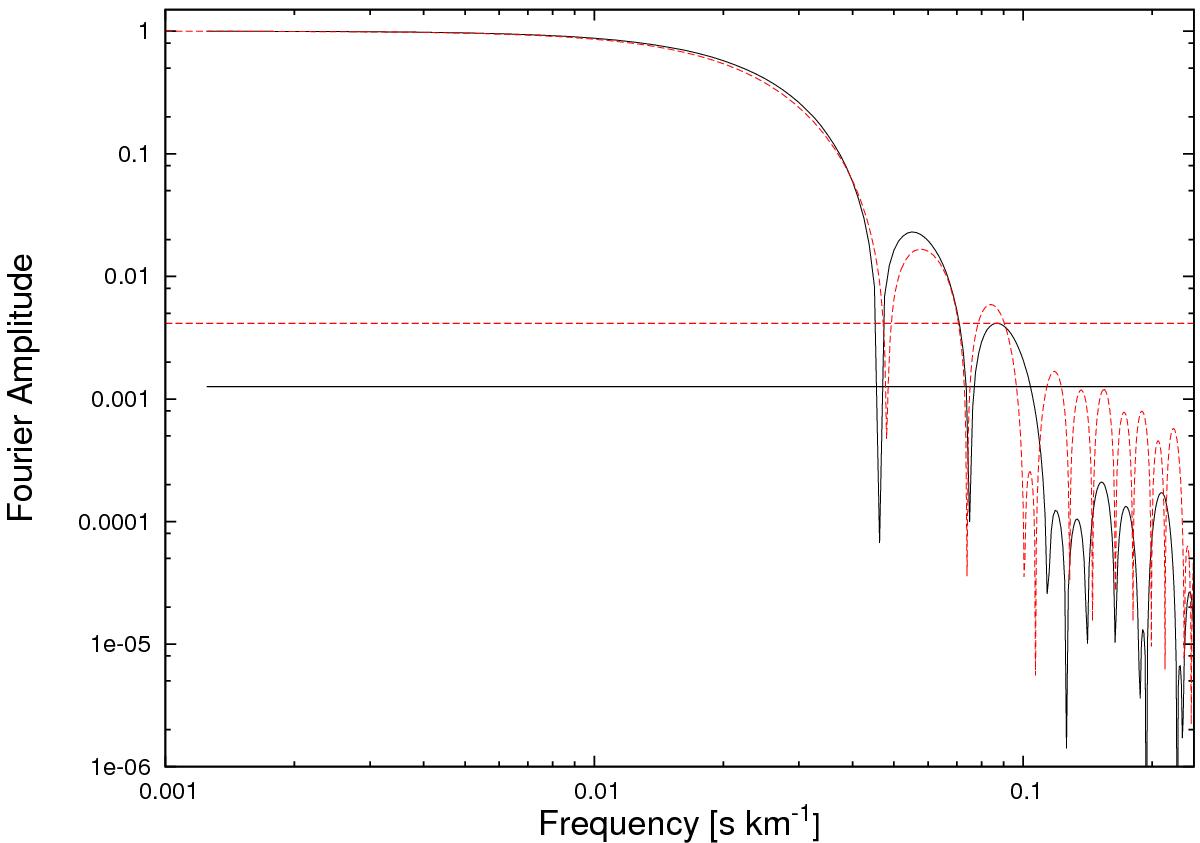
Amplitude of the Fourier transform of a mean line profile. Red dashed line refers to the LSD software, black solid line to the HARPS-N CCF. The horizontal lines show the noise level.
Current usage metrics show cumulative count of Article Views (full-text article views including HTML views, PDF and ePub downloads, according to the available data) and Abstracts Views on Vision4Press platform.
Data correspond to usage on the plateform after 2015. The current usage metrics is available 48-96 hours after online publication and is updated daily on week days.
Initial download of the metrics may take a while.