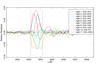
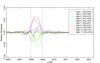
Fig. 3

Residuals relative to the average spectrum of the Ca ii K (top panel) and H (bottom panel) lines. The color code (online version only) is reported in the legend, together with the S/N in the line for a 1 Å spectral element (night 4 has been excluded, see text). The residuals have been smoothed to avoid cluttering; for this reason, they slightly exceed the vertical dashed lines.
Current usage metrics show cumulative count of Article Views (full-text article views including HTML views, PDF and ePub downloads, according to the available data) and Abstracts Views on Vision4Press platform.
Data correspond to usage on the plateform after 2015. The current usage metrics is available 48-96 hours after online publication and is updated daily on week days.
Initial download of the metrics may take a while.