Free Access
Fig. 2
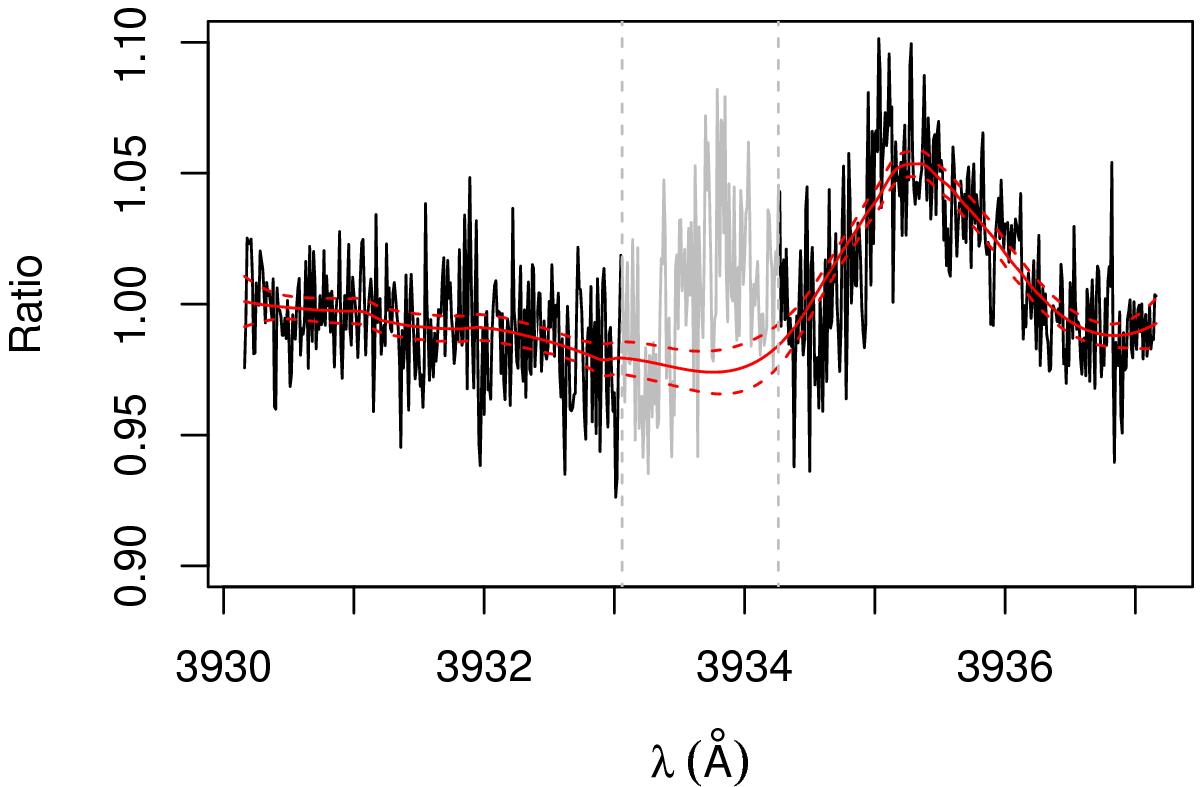
Example of the low-order correction of the Ca ii K line. The black line is the ratio of one spectrum in the series to the reference spectrum, while the red line is the low-order fit (95% confidence band is shown with red dashes). The vertical dashed lines bracket the line core, in gray, which is excluded from the fit.
Current usage metrics show cumulative count of Article Views (full-text article views including HTML views, PDF and ePub downloads, according to the available data) and Abstracts Views on Vision4Press platform.
Data correspond to usage on the plateform after 2015. The current usage metrics is available 48-96 hours after online publication and is updated daily on week days.
Initial download of the metrics may take a while.