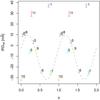
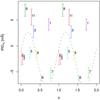
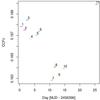
Fig. 12
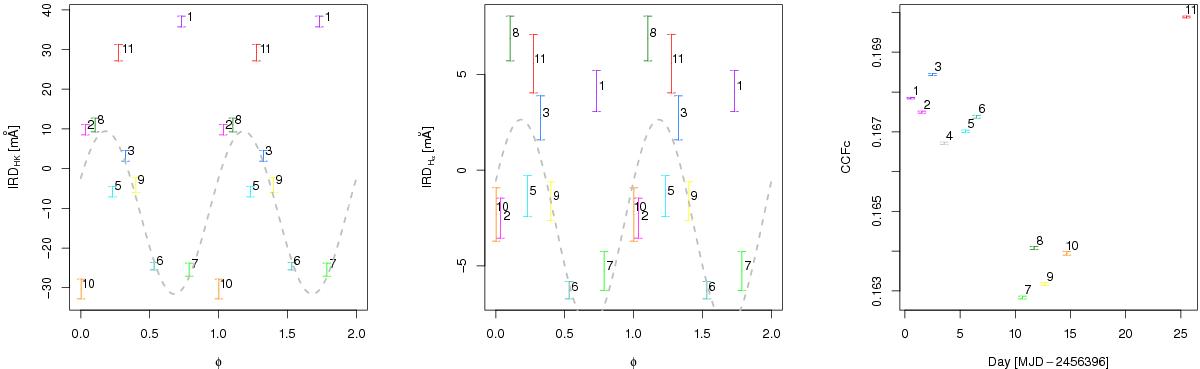
Left panel: phase-folded diagram of IRDHK. Middle panel: IRDHα. Right panel: time series of the CCFc measurements. The planetary inferior conjunction is at φ = 0. Colors (online version only) and numbers are the same as in the previous figures. In the left and middle panel, the gray dashed line is the least-squares best fit discussed in the text. We also report in the text the relative likelihood of the sinusoidal fit with respect to the flat model returned by the AICc.
Current usage metrics show cumulative count of Article Views (full-text article views including HTML views, PDF and ePub downloads, according to the available data) and Abstracts Views on Vision4Press platform.
Data correspond to usage on the plateform after 2015. The current usage metrics is available 48-96 hours after online publication and is updated daily on week days.
Initial download of the metrics may take a while.