Fig. 10
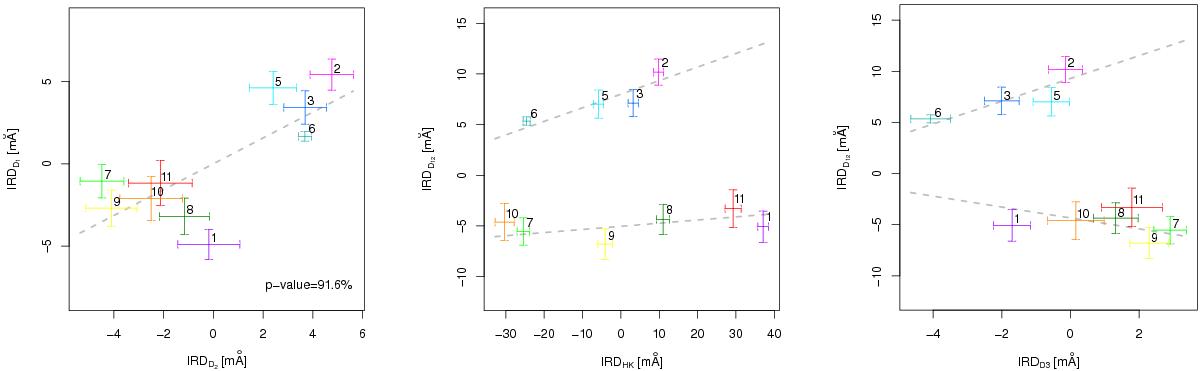
Left panel: IRDD1 vs. IRDD2. Middle panel: IRDD12 vs. IRDHK. Right panel: IRDD12 vs. IRDD3. In all panels, the color code (online version only) is the same as in Fig. 3 and represents different observation dates. The numbers above the data points indicate the ordered sequence in the series of observations. In the left panel, the number at the bottom is the confidence returned by the correlation test. In the middle and right panels, the two dashed gray lines are drawn by hand to highlight the bifurcation discussed in the text.
Current usage metrics show cumulative count of Article Views (full-text article views including HTML views, PDF and ePub downloads, according to the available data) and Abstracts Views on Vision4Press platform.
Data correspond to usage on the plateform after 2015. The current usage metrics is available 48-96 hours after online publication and is updated daily on week days.
Initial download of the metrics may take a while.