Fig. 1
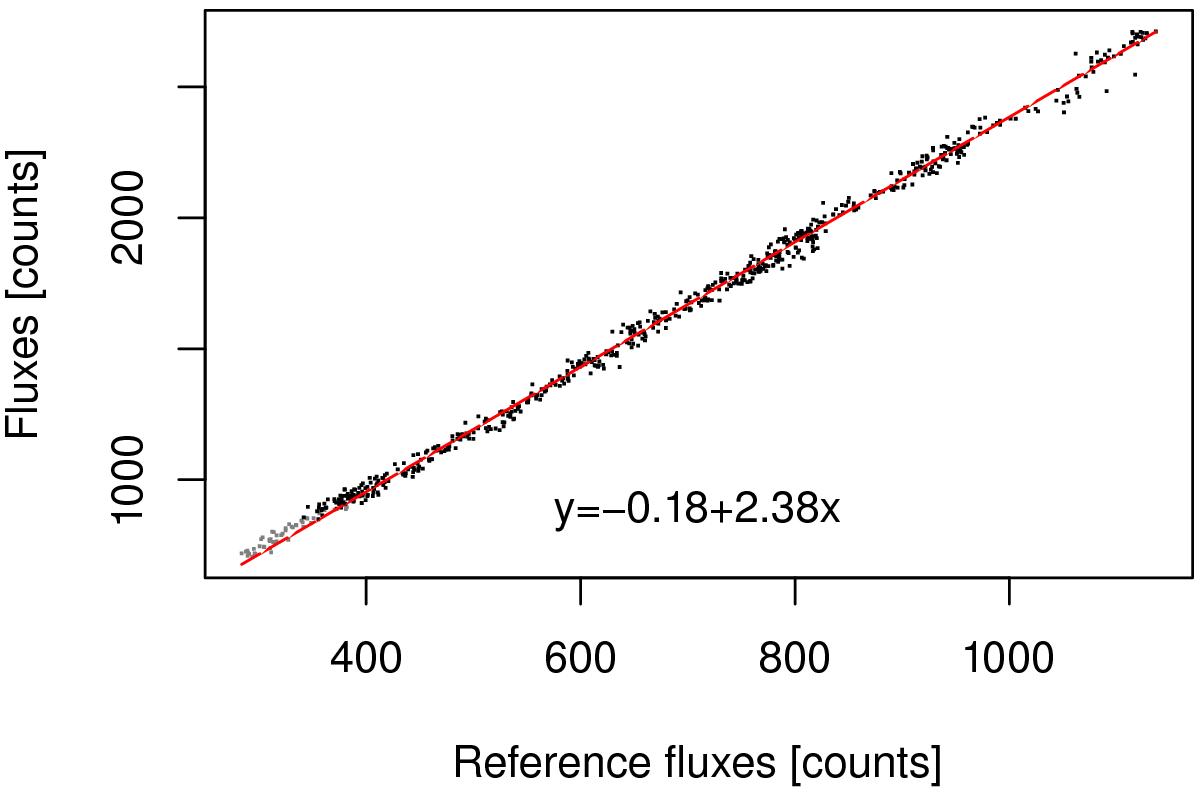
Example of the flux calibration of the mean spectrum of night 3 over the mean spectrum of night 6 in the Ca ii K spectral range. The best fit (red line) is computed using the black dots, which represent instrumental fluxes out of the line core. The instrumental fluxes of the line core (in gray) are not included in the fit. The equation of the best fit is also shown.
Current usage metrics show cumulative count of Article Views (full-text article views including HTML views, PDF and ePub downloads, according to the available data) and Abstracts Views on Vision4Press platform.
Data correspond to usage on the plateform after 2015. The current usage metrics is available 48-96 hours after online publication and is updated daily on week days.
Initial download of the metrics may take a while.