Fig. 8
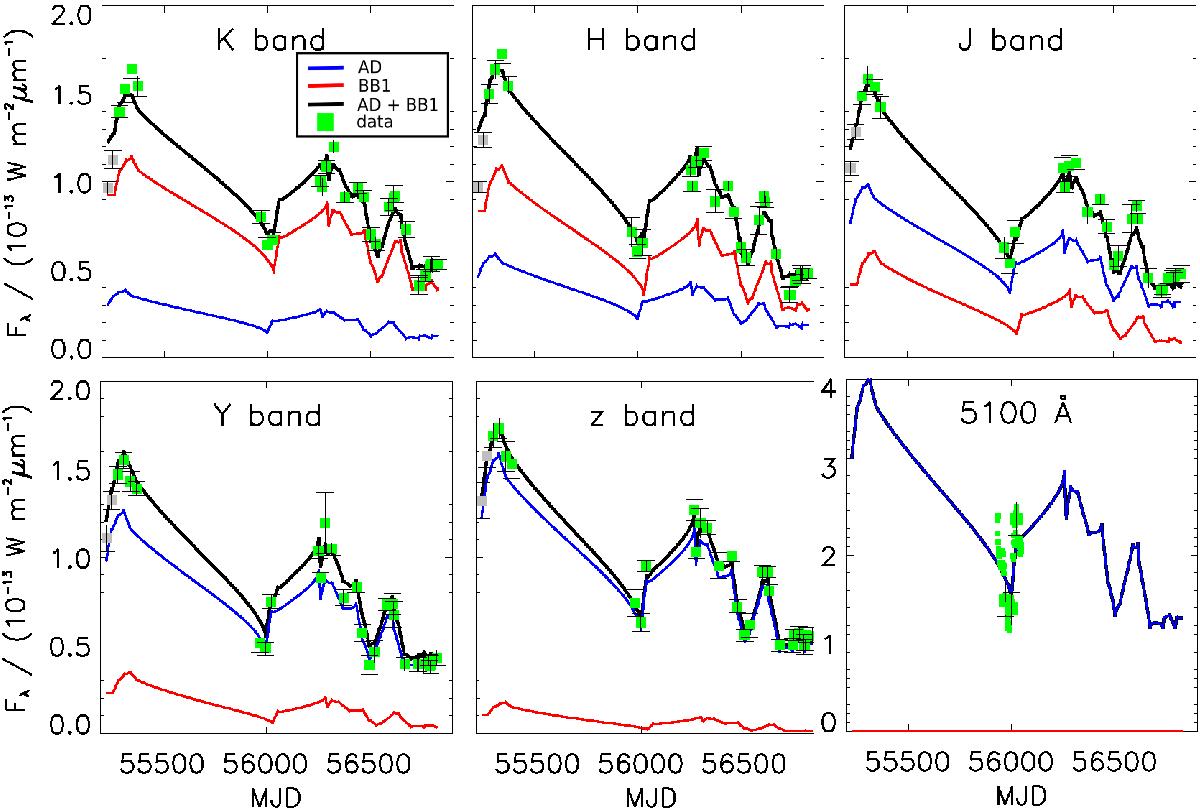
Results of our 1BB model fit. Plotted are the K,H,J,Y,z, and 5100 Å data (green) over time. The bigger dots with errors bars in the 5100 Å panel mark the data points that coincide with our NIR epochs. The red line represents the blackbody contribution for each band, blue the AD contribution, and the black line is the sum of both. Epochs 1 and 2 are not included in the evaluation of the fit (as t<τ).
Current usage metrics show cumulative count of Article Views (full-text article views including HTML views, PDF and ePub downloads, according to the available data) and Abstracts Views on Vision4Press platform.
Data correspond to usage on the plateform after 2015. The current usage metrics is available 48-96 hours after online publication and is updated daily on week days.
Initial download of the metrics may take a while.