Fig. 14
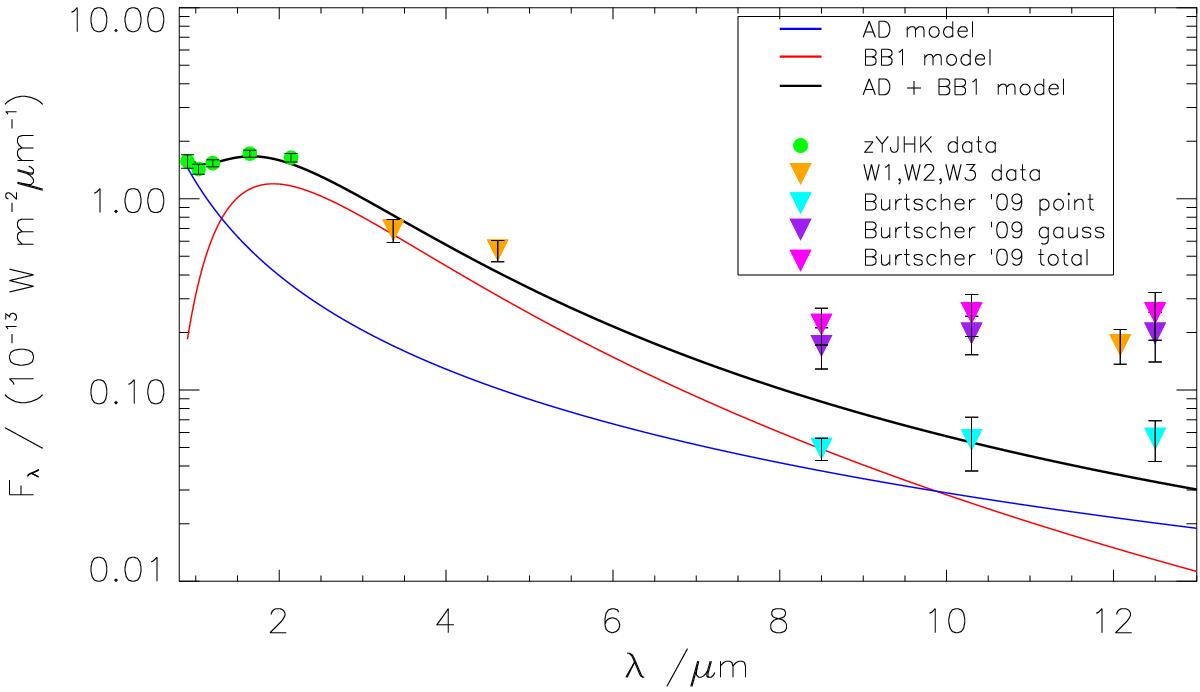
Resulting fluxes from the 1BB model fit in the high temperature epoch 5, plotted over wavelength. Overplotted are our derived NIR and MIR fluxes (zYJHK and W1, W2, W3). The 1BB model roughly matches the MIR point source fluxes, given by Burtscher et al. (2009). Since the model was fit to our zYJHK data alone (also see Sect. 5.2), these are marked with green circles, while the other data are represented by triangles.
Current usage metrics show cumulative count of Article Views (full-text article views including HTML views, PDF and ePub downloads, according to the available data) and Abstracts Views on Vision4Press platform.
Data correspond to usage on the plateform after 2015. The current usage metrics is available 48-96 hours after online publication and is updated daily on week days.
Initial download of the metrics may take a while.