Fig. 5
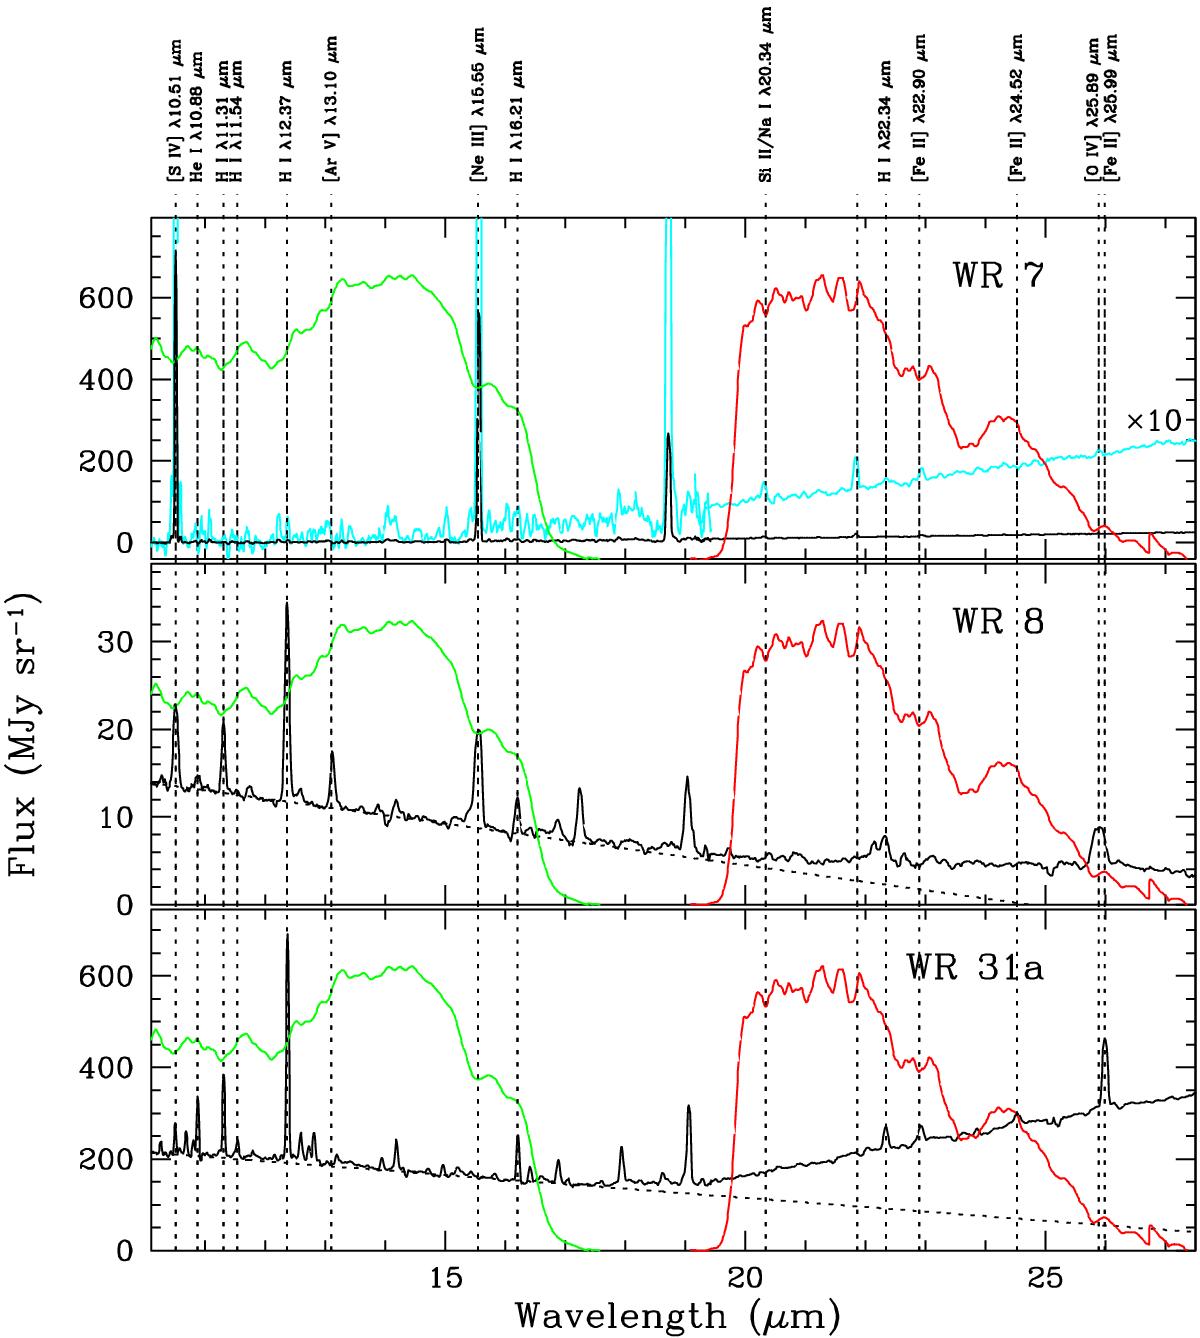
Spitzer IRS SH and LH spectra of the nebulae around WR 7, WR 8, and WR 31a. The spectral responses of the W3 (green) and W4 (red) WISE bands normalized to arbitrary values are overplotted on the spectra. The nebular spectrum of WR 7 corresponds to the patch of bright red emission (the WISE W4 band) towards the northwest shown in Fig. A.1. This spectrum has been plotted at two different intensity levels to highlight the low level emission. The contribution of the stellar emission of WR 8 and WR 31a to the nebular spectra can be roughly reproduced by a black-body model (dashed line).
Current usage metrics show cumulative count of Article Views (full-text article views including HTML views, PDF and ePub downloads, according to the available data) and Abstracts Views on Vision4Press platform.
Data correspond to usage on the plateform after 2015. The current usage metrics is available 48-96 hours after online publication and is updated daily on week days.
Initial download of the metrics may take a while.