Fig. 9
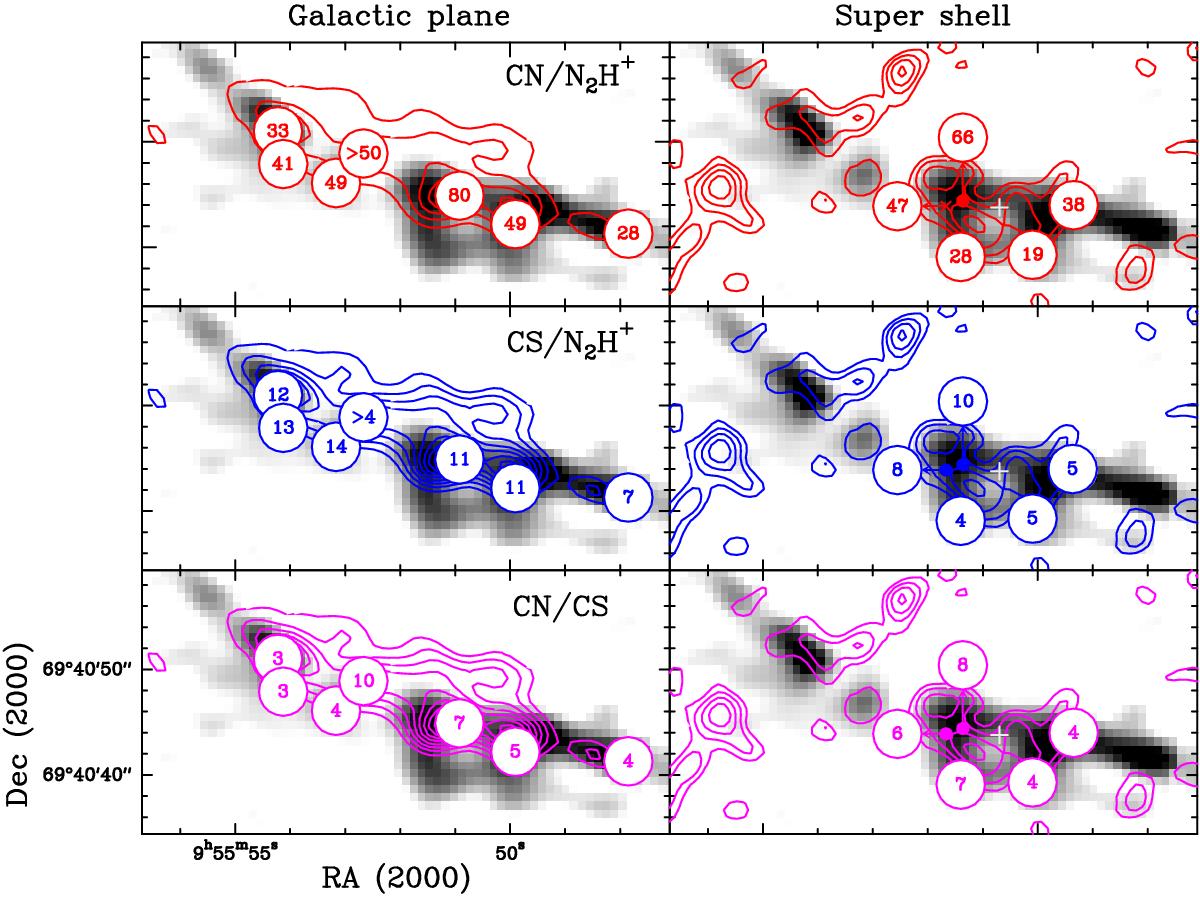
[CN]/[N2H+], [CS]/[N2H+] and [CN]/[CS] abundance ratios for the positions listed in Table 2 in the galacic plane (left) and the supershell associated with SN 41.9+58 (right) superposed to the N2H+1 → 0 integrated intensity map (gray scale). For comparison, in the left column we plot the contours of the integrated intensity emission of the H (41) α line, and in the right, the integrated intensity emission of the SiO 2 → 1 line (García-Burillo et al. 2001). The white cross indicates the position of SN 41.9+58.
Current usage metrics show cumulative count of Article Views (full-text article views including HTML views, PDF and ePub downloads, according to the available data) and Abstracts Views on Vision4Press platform.
Data correspond to usage on the plateform after 2015. The current usage metrics is available 48-96 hours after online publication and is updated daily on week days.
Initial download of the metrics may take a while.