Fig. 7
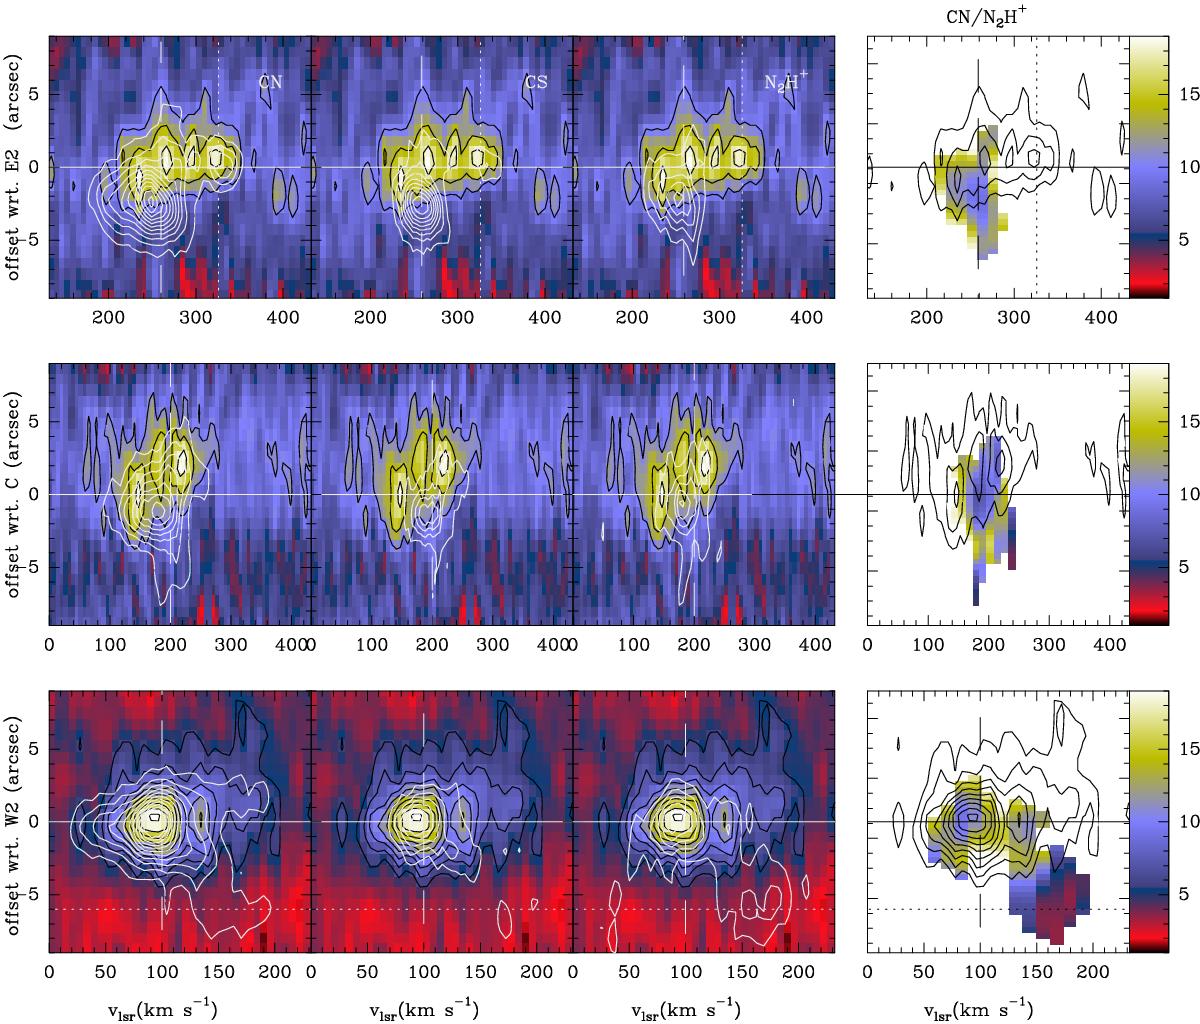
p-v diagrams along cuts perpendicular to the galactic plane at E2 (top), the (0, 0) position (middle) and W2 (bottom). Color scale and black contours correspond to the H(41)α emission. White contours are intensities of the CN 1 → 0, CS 3 → 2 and N2H+1 → 0 lines. First contours (3 × σ) and steps are 10 mJy/beam for CN and CS, 2 mJy/beam for N2H+, and H(41)α. The CN 1 → 0/N2H+1 → 0 line intensity (in Tb units) ratio along these cuts is shown in the right column. The images have been degraded to a angular resolution of 3.8″ and a velocity resolution of 12 km s-1 to show this line ratio. Vertical lines indicate the position of the velocity components discussed in the text.
Current usage metrics show cumulative count of Article Views (full-text article views including HTML views, PDF and ePub downloads, according to the available data) and Abstracts Views on Vision4Press platform.
Data correspond to usage on the plateform after 2015. The current usage metrics is available 48-96 hours after online publication and is updated daily on week days.
Initial download of the metrics may take a while.