Fig. 2
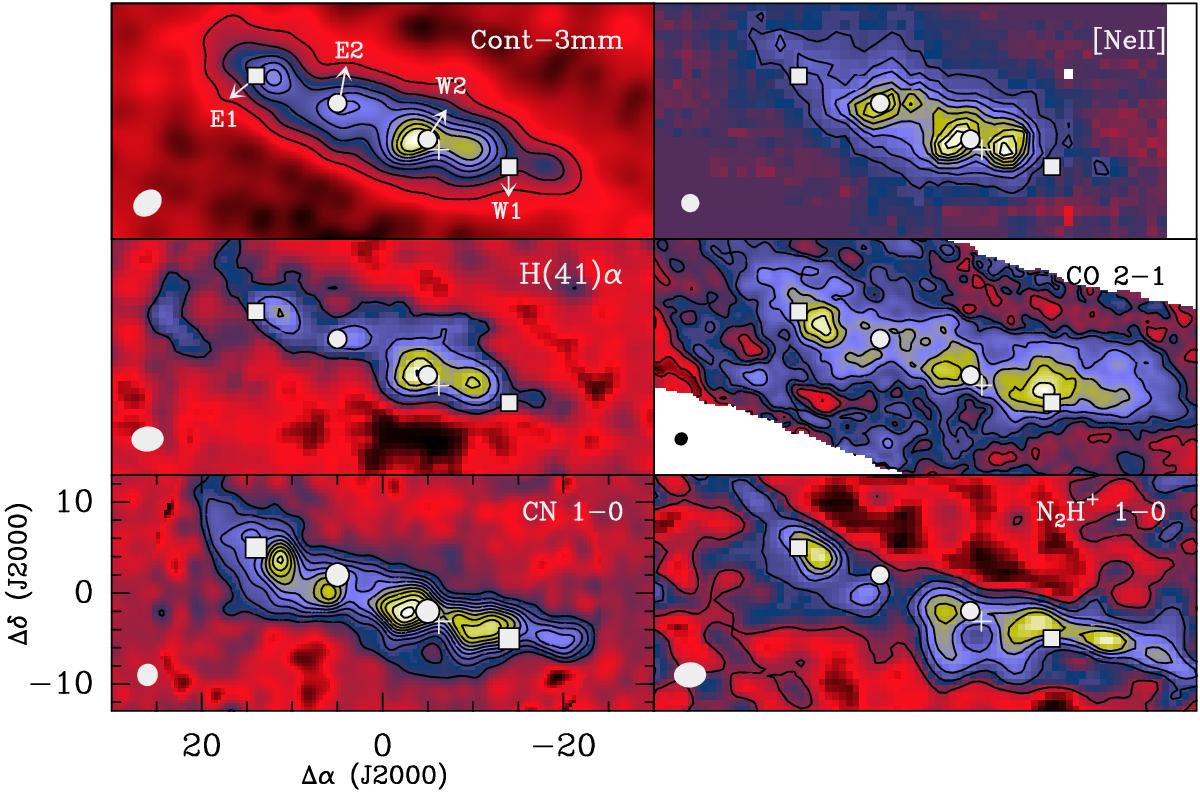
Map of the continuum emission at 3 mm (Fuente et al. 2008) and line-integrated intensity maps of the 12.8 μm line of [NeII] (Achtermann & Lacy 1995), H(41)α, CO 2 → 1, CN 1 → 0, and N2H+1 → 0 lines. The beam is drawn in the lower left corner of the panels, and positions E1, E2, W2, and W1 are indicated by filled polygons. The position of SN 41.9+58 is marked with a white cross. First contour is at 3 × σ level. Contour levels are 1.7 mJy/beam, 5 mJy/beam to 35 mJy/beam in steps of 5 mJy/beam (cont – 3 mm); 0.13 Jy/beam to 1.04 Jy/beam in steps of 0.13 Jy/beam ([NeII]); 4 to 28 in steps of 4 K × km s-1 (H(41) α); 200, 400, 600, 800, 1200, 1600, 2000, 2400 K × km s-1 (CO); 15.8 to 252.8 in steps of 15.8 K × km s-1 (CN); 2.5, 5.0, 7.5, 10.0, 12.5 K × km s-1 (N2H+). Color scale is adjusted to the lowest and highest values in each panel.
Current usage metrics show cumulative count of Article Views (full-text article views including HTML views, PDF and ePub downloads, according to the available data) and Abstracts Views on Vision4Press platform.
Data correspond to usage on the plateform after 2015. The current usage metrics is available 48-96 hours after online publication and is updated daily on week days.
Initial download of the metrics may take a while.