Fig. 3
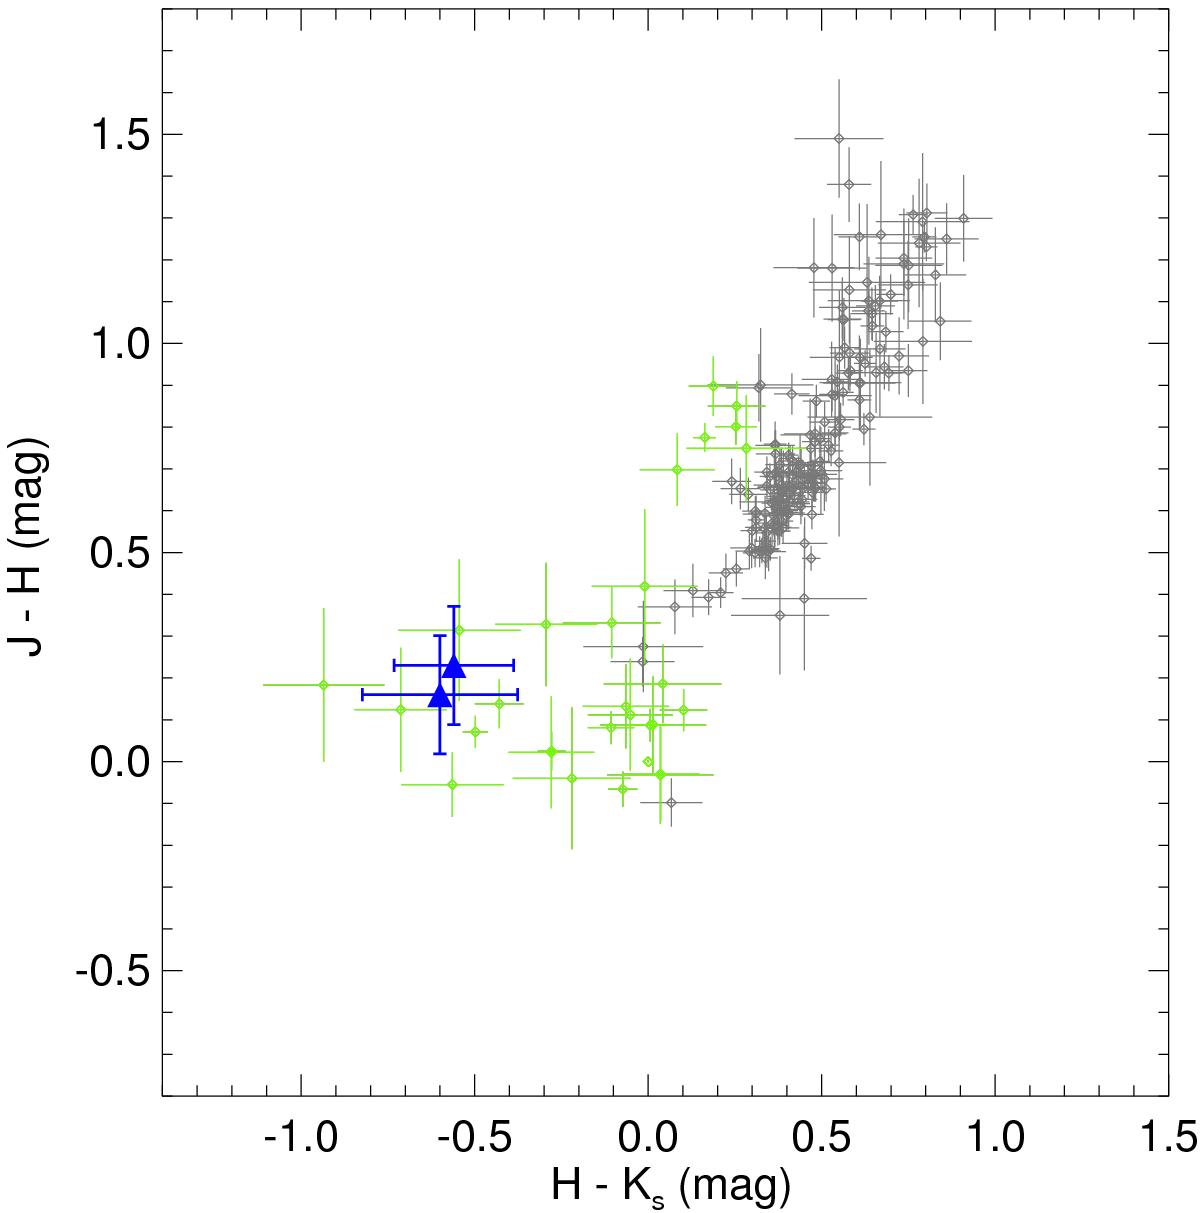
Color–color near-IR diagram. We have included a sample of ultracool dwarfs from Dupuy & Liu (2012): the small gray diamonds represent M and L dwarfs, while the green diamonds are T dwarfs. We have only plotted objects with photometric uncertainties smaller or equal to 0.2 mag. The binary components of WISE0612 are represented by blue triangles.
Current usage metrics show cumulative count of Article Views (full-text article views including HTML views, PDF and ePub downloads, according to the available data) and Abstracts Views on Vision4Press platform.
Data correspond to usage on the plateform after 2015. The current usage metrics is available 48-96 hours after online publication and is updated daily on week days.
Initial download of the metrics may take a while.