Fig. 8
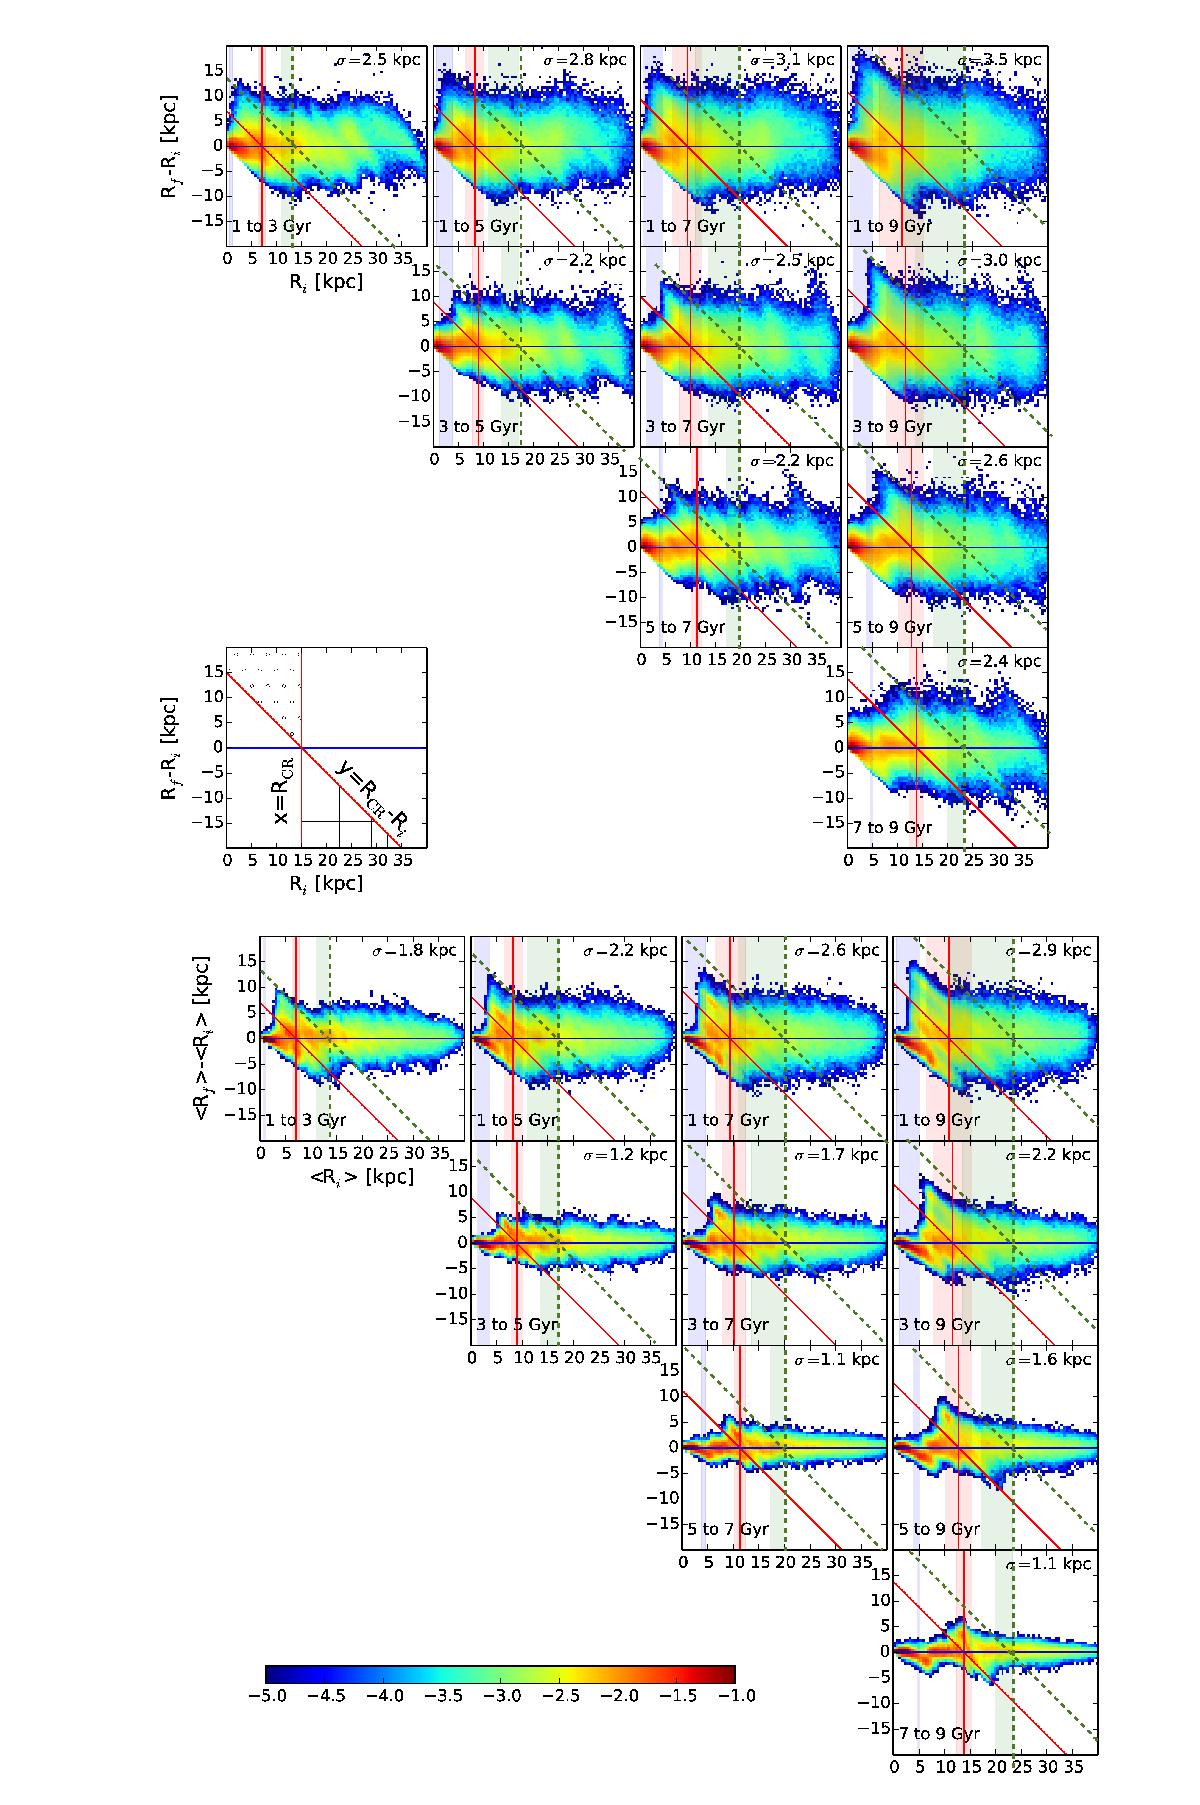
Distributions of the variations of galactocentric radii (top half) and guiding radii (bottom half). The colour of each bin signifies the stellar mass in the bin and the colour scale shown at the bottom of the figure applies everywhere. The shaded areas represent the bar ILR (blue), CR (red), and OLR (green) radii variation in the time-span of each plot. The red vertical lines are the average of the bar CR radius during the time-span of a plot. The diagonal red lines help identify the migrators that cross the bar CR radius from lower radii (dot-shaded part of the schematic plot) or from larger radii (grid-shaded part). The diagonal green lines similarly help identify migration with respect to the OLR radius at the end of the time interval.
Current usage metrics show cumulative count of Article Views (full-text article views including HTML views, PDF and ePub downloads, according to the available data) and Abstracts Views on Vision4Press platform.
Data correspond to usage on the plateform after 2015. The current usage metrics is available 48-96 hours after online publication and is updated daily on week days.
Initial download of the metrics may take a while.