Fig. 3
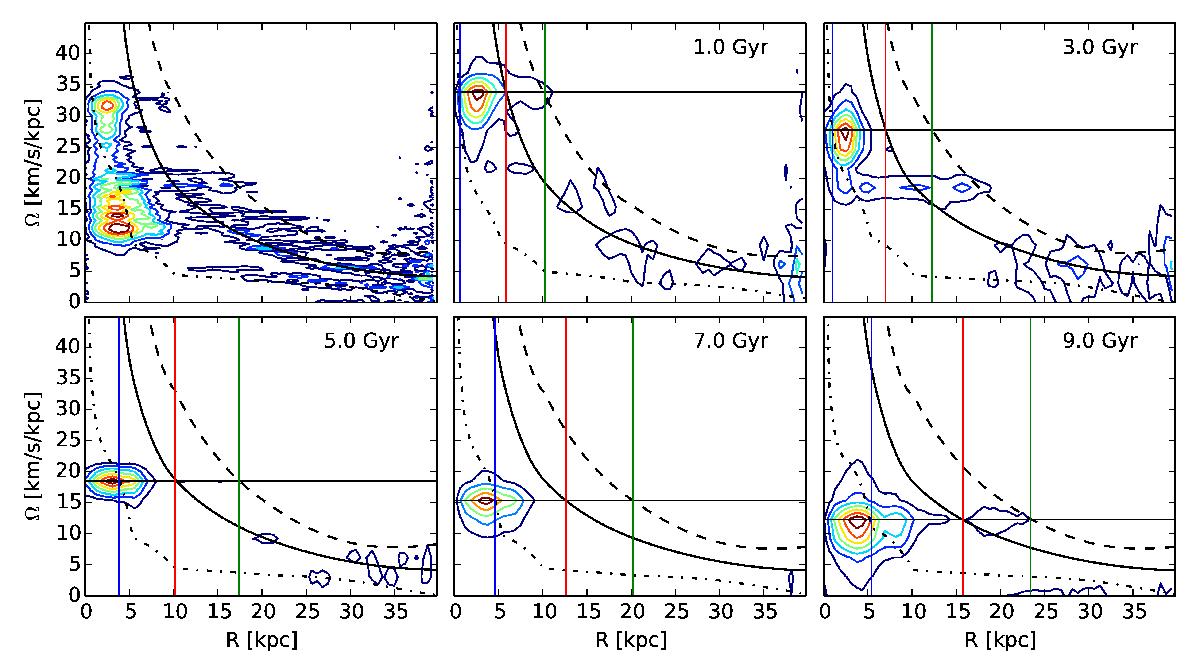
Spectrograms of the m = 2 Fourier mode. Top left plot: integration on 9 Gyr from 0.5 Gyr to 9.5 Gyr. Other plots: integrations on 1 Gyr centred on the times specified in the plots. The black curves are Ω(R) (solid), ![]() (dot-dashed),
(dot-dashed), ![]() (dashed). The horizontal line represents the estimate of the bar pattern speed. The vertical lines represent the estimates of the bar ILR (blue), corotation (red), and OLR (green) radii.
(dashed). The horizontal line represents the estimate of the bar pattern speed. The vertical lines represent the estimates of the bar ILR (blue), corotation (red), and OLR (green) radii.
Current usage metrics show cumulative count of Article Views (full-text article views including HTML views, PDF and ePub downloads, according to the available data) and Abstracts Views on Vision4Press platform.
Data correspond to usage on the plateform after 2015. The current usage metrics is available 48-96 hours after online publication and is updated daily on week days.
Initial download of the metrics may take a while.