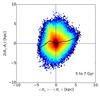
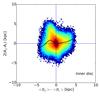
Fig. 24
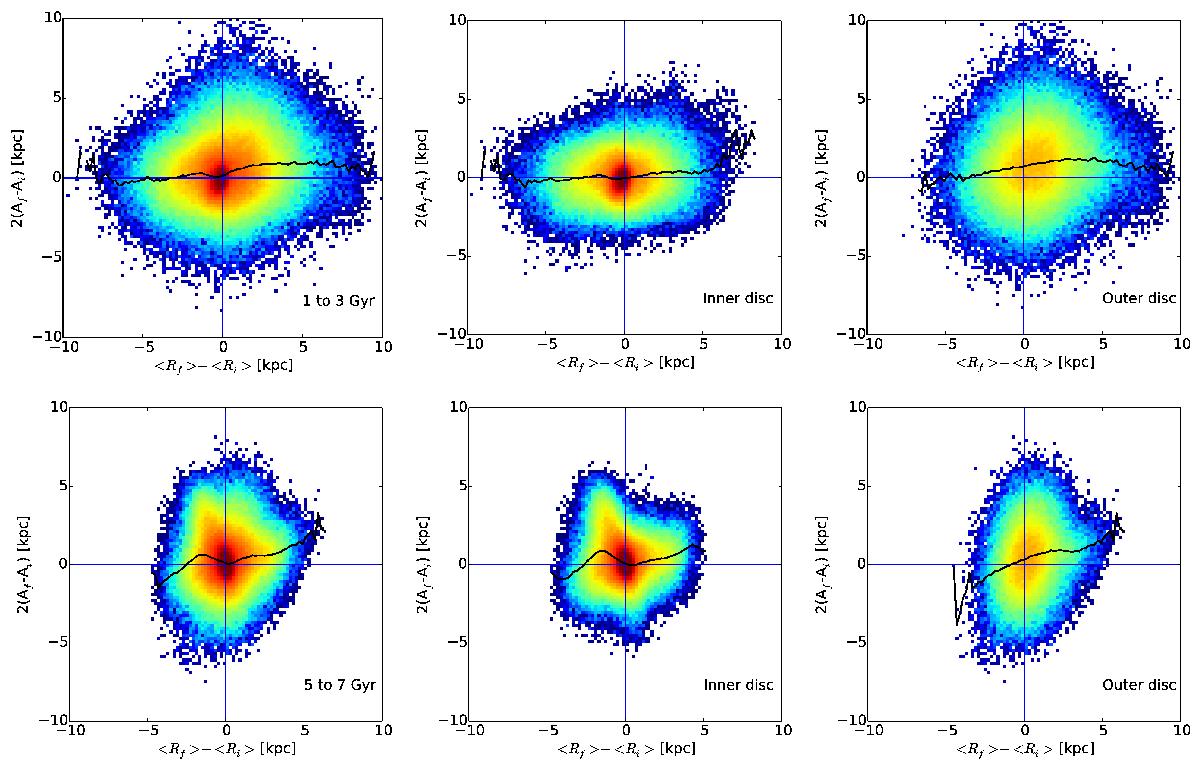
Change of radial oscillation amplitude as a function of change of guiding radius from 1 to 3 Gyr (top) and 5 to 7 Gyr (bottom). The colour scale represents the mass in each bin and is logarithmic. The solid black line is the average of the change in amplitude by bin of change of guiding radius (i.e. the average of the corresponding column).
Current usage metrics show cumulative count of Article Views (full-text article views including HTML views, PDF and ePub downloads, according to the available data) and Abstracts Views on Vision4Press platform.
Data correspond to usage on the plateform after 2015. The current usage metrics is available 48-96 hours after online publication and is updated daily on week days.
Initial download of the metrics may take a while.