Fig. 17
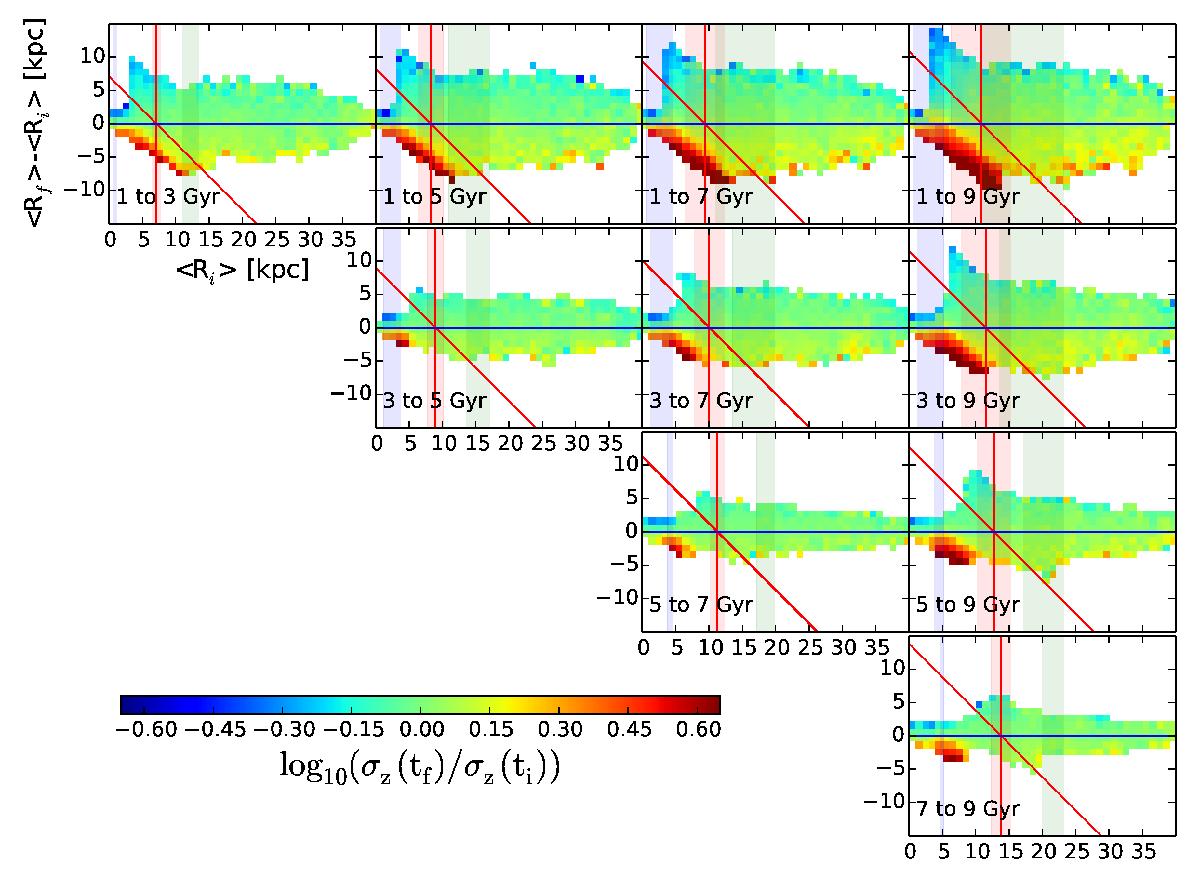
Ratio of vertical velocity dispersion of stars in bins in ⟨ Ri ⟩ and ⟨ Rf ⟩ − ⟨ Ri ⟩ to the vertical velocity dispersion of all stars in radial bin centred on ⟨ Ri ⟩. The shaded areas represent the bar ILR (blue), CR (red), and OLR (green) radii variation in the time-span of each plot. The red vertical lines are the average of the bar CR radius during the time-span of a plot.
Current usage metrics show cumulative count of Article Views (full-text article views including HTML views, PDF and ePub downloads, according to the available data) and Abstracts Views on Vision4Press platform.
Data correspond to usage on the plateform after 2015. The current usage metrics is available 48-96 hours after online publication and is updated daily on week days.
Initial download of the metrics may take a while.