Fig. 14
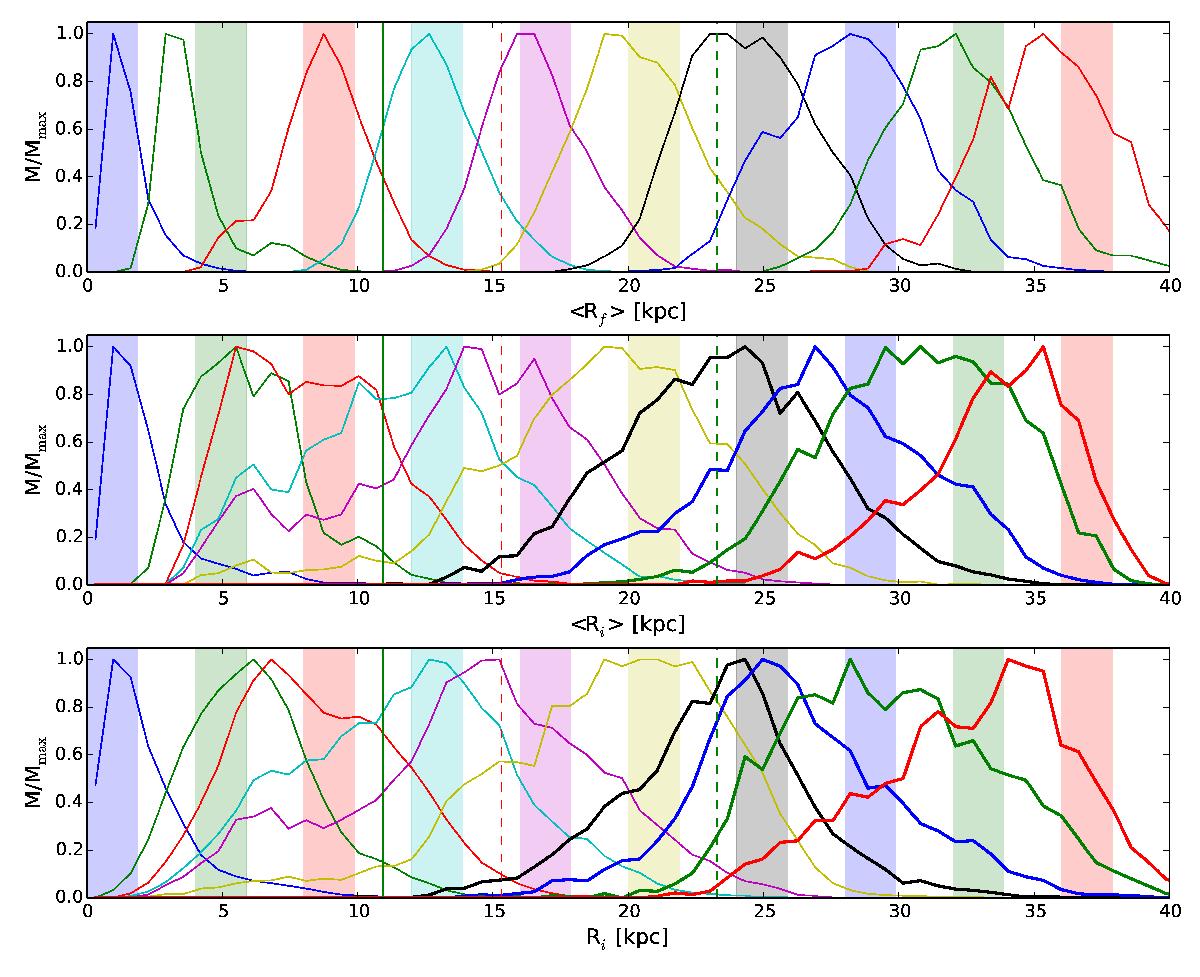
Distributions of final guiding radii (top), initial guiding radii (middle), and initial galactocentric radii (bottom) of stars whose final galactocentric radii belong to bins of 2 kpc width. Each curve corresponds to the closest same-colour shaded bin of final galactocentric radii. The time interval is from 1 Gyr to 9 Gyr. The vertical dashed lines are the CR (red) and OLR (green) radii at 9 Gyr. The vertical solid green line is the OLR radius at 1 Gyr. In the two bottom lines, the histograms corresponding to stars in radius bins outside the OLR radius at 9 Gyr have been plotted with thicker lines (see next section). The stellar masses M in bins of each histogram are divided by the largest mass Mmax contained in a bin of the histogram.
Current usage metrics show cumulative count of Article Views (full-text article views including HTML views, PDF and ePub downloads, according to the available data) and Abstracts Views on Vision4Press platform.
Data correspond to usage on the plateform after 2015. The current usage metrics is available 48-96 hours after online publication and is updated daily on week days.
Initial download of the metrics may take a while.