Fig. 13
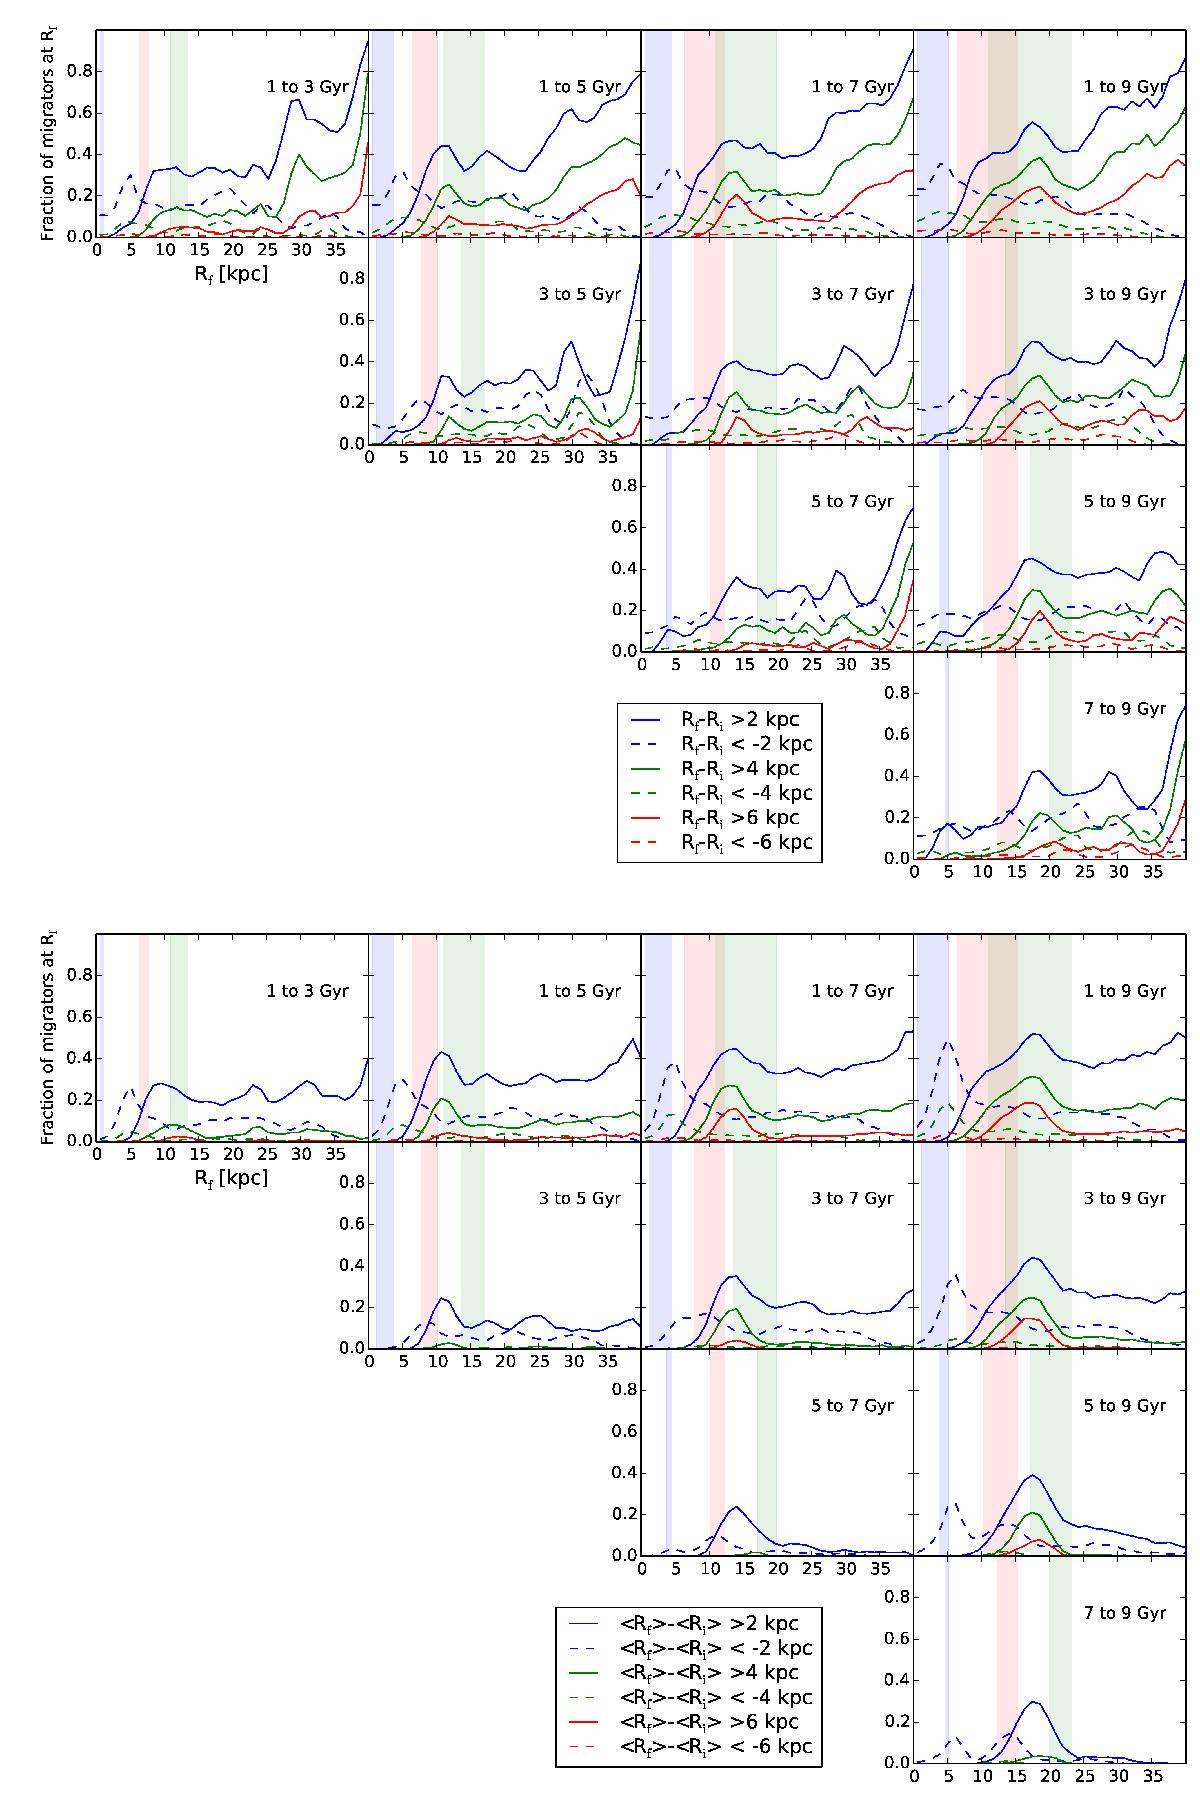
Fraction of migrators as a function of radius (top half) or guiding radius (bottom half) at the end of the time-span specified in each plot. The shaded areas represent the bar ILR (blue), CR (red), and OLR (green) radii variation in the time-span of each plot. Note that these values are obtained with an isolated galactic disc with specific size parameters (possibly more extended than the Milky Way disc) and are not applicable to any specific galaxy.
Current usage metrics show cumulative count of Article Views (full-text article views including HTML views, PDF and ePub downloads, according to the available data) and Abstracts Views on Vision4Press platform.
Data correspond to usage on the plateform after 2015. The current usage metrics is available 48-96 hours after online publication and is updated daily on week days.
Initial download of the metrics may take a while.