Fig. 12
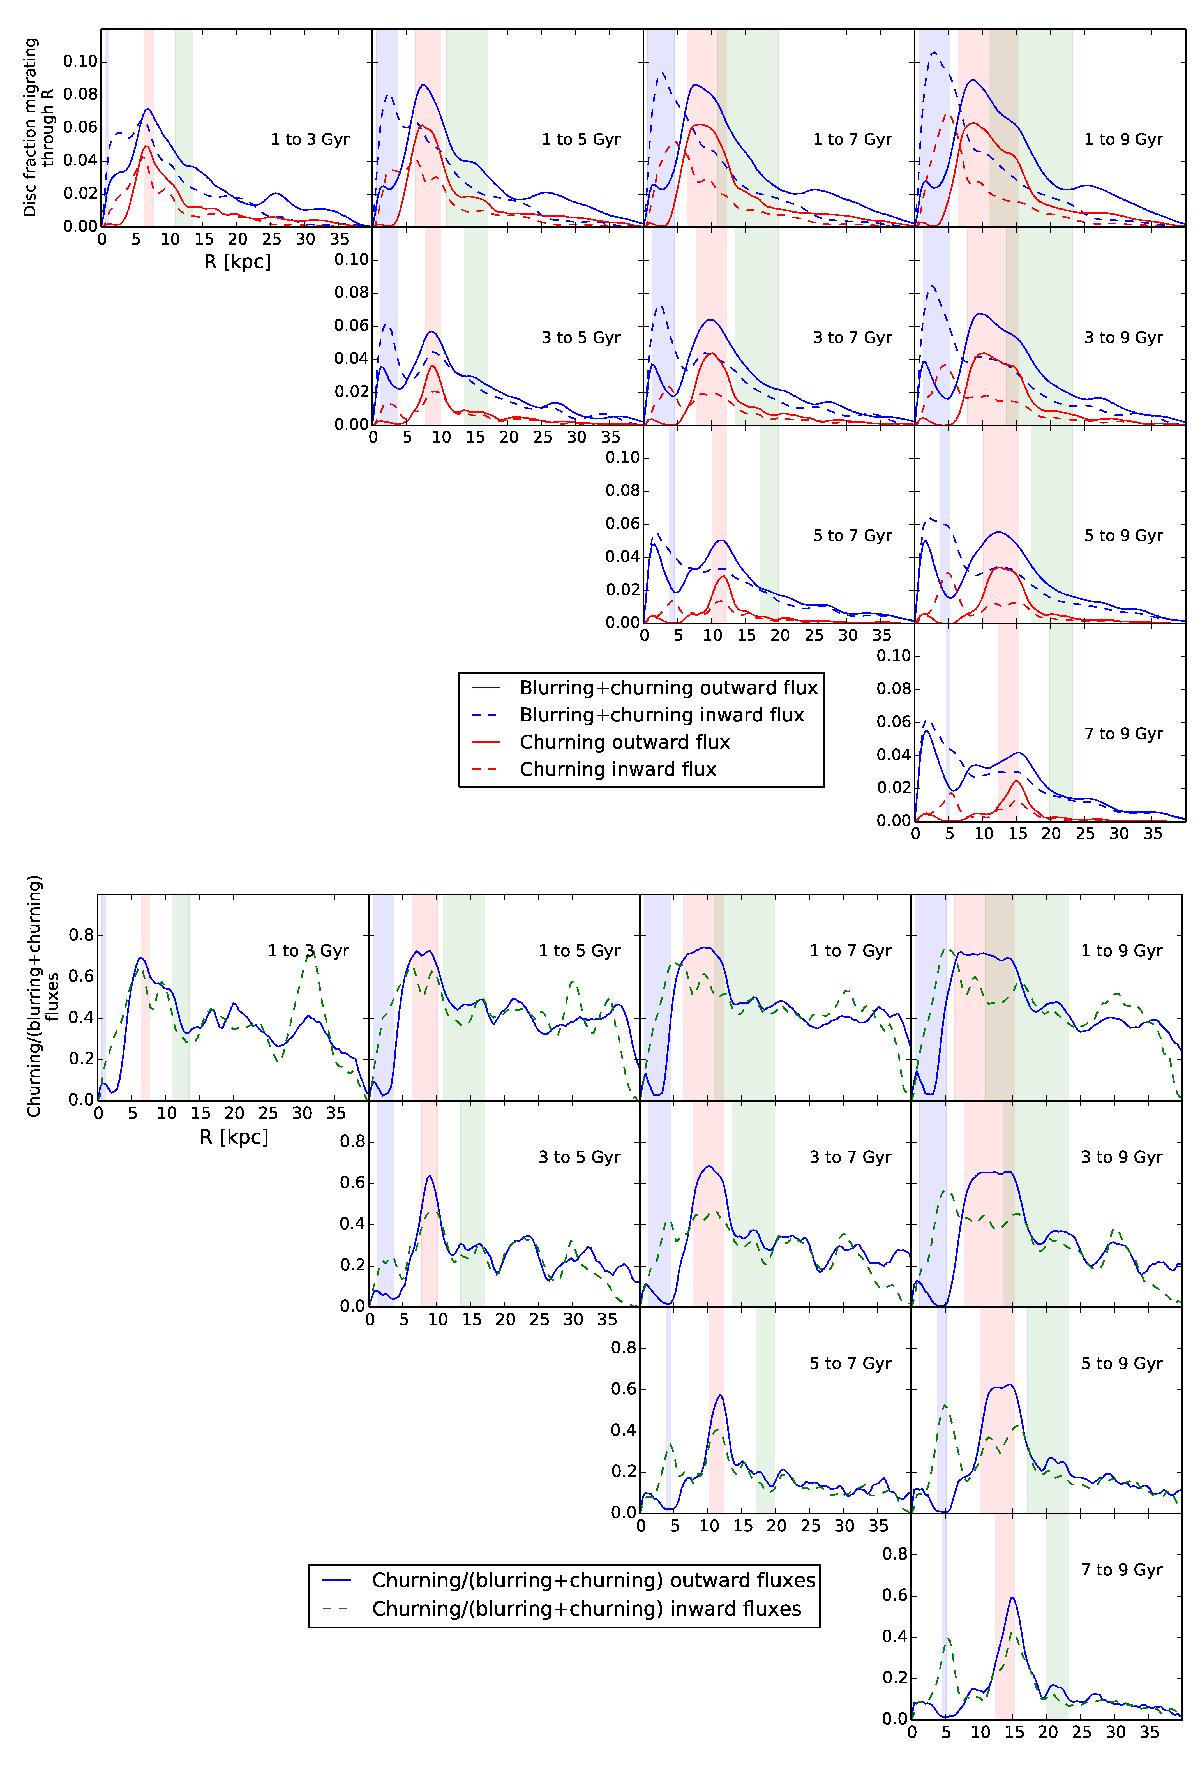
Top half: mass fraction of the stellar disc crossing a radius R in terms of radius (apparent migration) or both radius and guiding radius (true migration). Bottom half: ratios of the true to apparent migrators. The shaded areas represent the bar ILR (blue), CR (red), and OLR (green) radii variation in the time-span of each plot.
Current usage metrics show cumulative count of Article Views (full-text article views including HTML views, PDF and ePub downloads, according to the available data) and Abstracts Views on Vision4Press platform.
Data correspond to usage on the plateform after 2015. The current usage metrics is available 48-96 hours after online publication and is updated daily on week days.
Initial download of the metrics may take a while.