Fig. 8
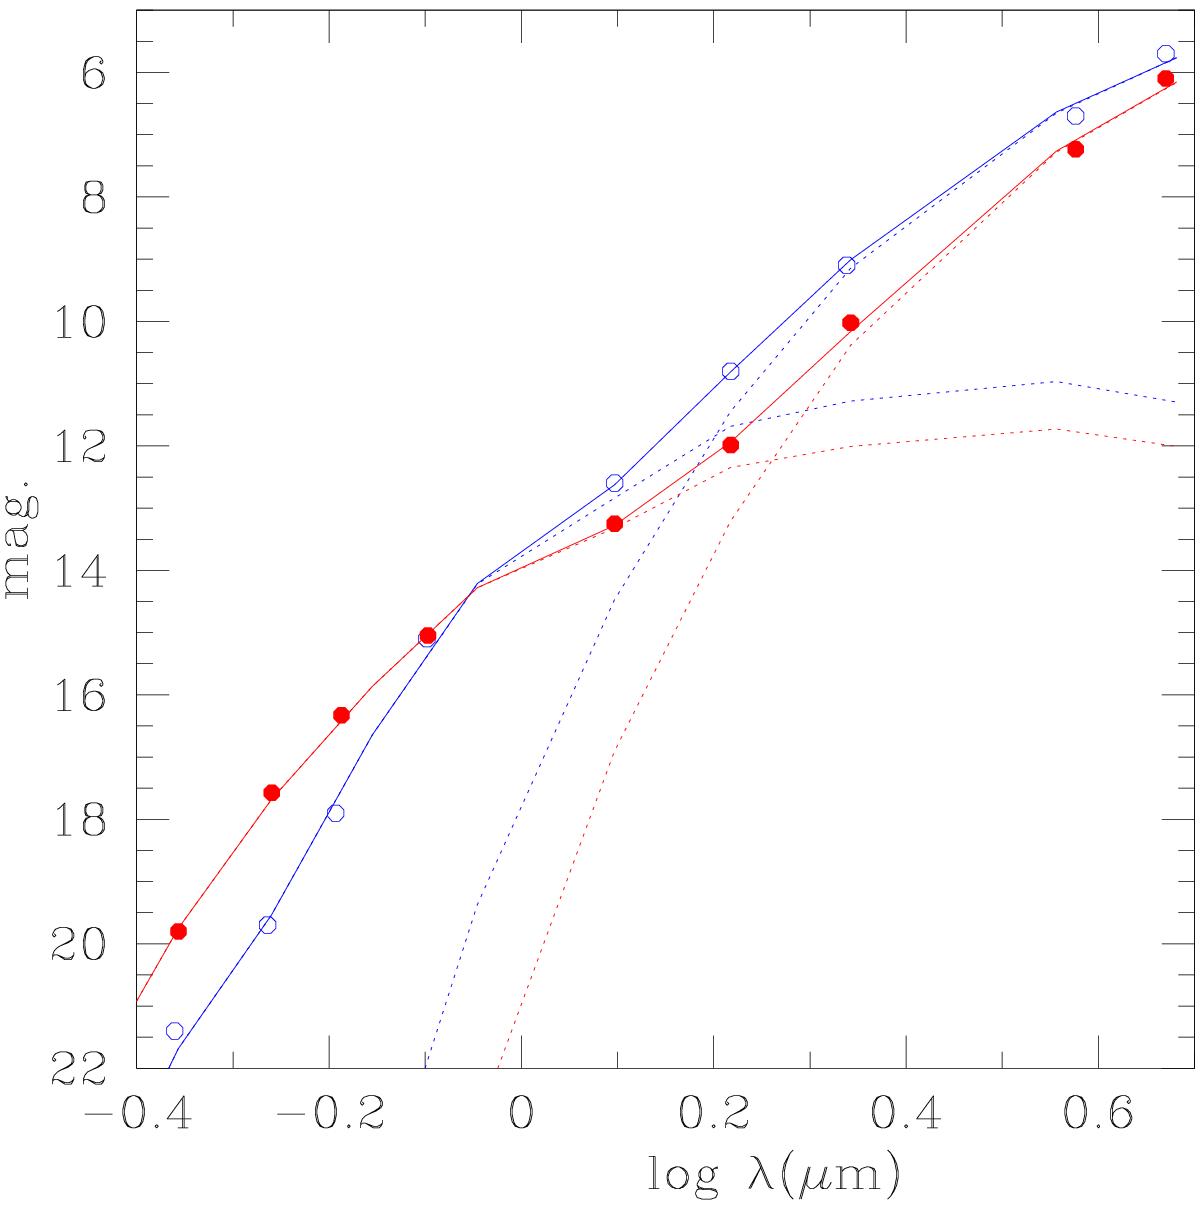
Comparison of the photometric measurements of V4332 Sgr in 2003 (red filled symbols: Tylenda et al. 2005) to those obtained in 2009 (blue open symbols: Kamiński et al. 2010). Full curves: model photometric spectra obtained by summing a standard stellar component with a black-body dust component (individual components are shown with dotted curves) reddened with EB−V = 0.35. See text for more details of the modelling.
Current usage metrics show cumulative count of Article Views (full-text article views including HTML views, PDF and ePub downloads, according to the available data) and Abstracts Views on Vision4Press platform.
Data correspond to usage on the plateform after 2015. The current usage metrics is available 48-96 hours after online publication and is updated daily on week days.
Initial download of the metrics may take a while.