Fig. 5
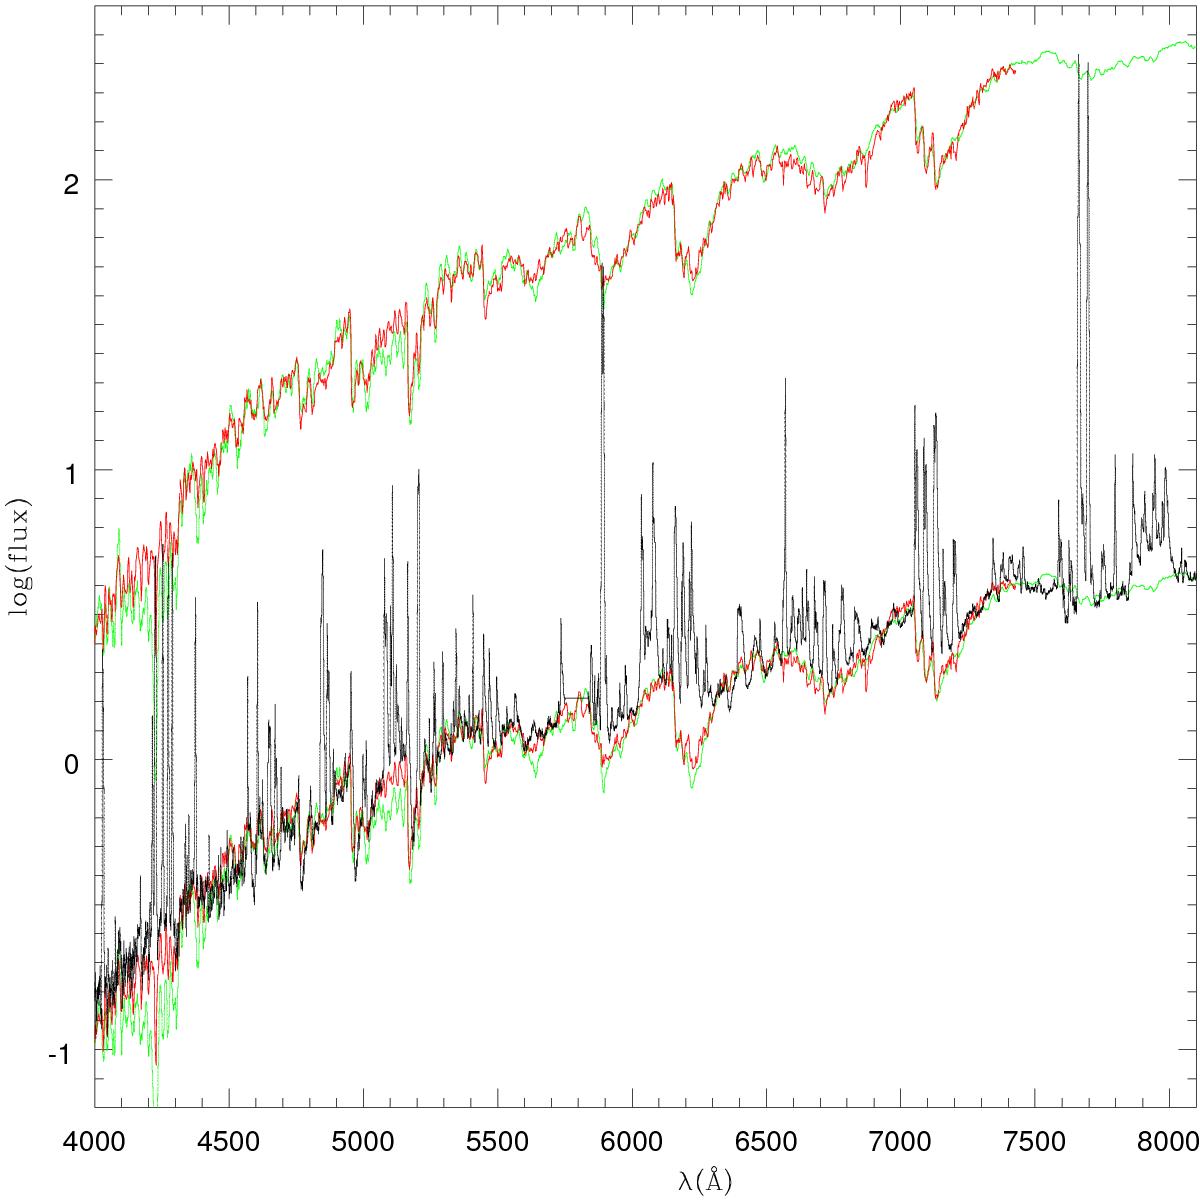
Reference (standard and model giant) spectra compared to the observed spectrum of V4332 Sgr (black). Red: M3 standard spectrum, green: model atmosphere (Teff = 3600 K, log g = 0.5). Reference spectra in the lower plots are reddened with EB−V = 0.35. Reference spectra in the upper plots are reddened with EB−V = 0.75 and shifted upward to match the highest fluxes of the strongest emission lines.
Current usage metrics show cumulative count of Article Views (full-text article views including HTML views, PDF and ePub downloads, according to the available data) and Abstracts Views on Vision4Press platform.
Data correspond to usage on the plateform after 2015. The current usage metrics is available 48-96 hours after online publication and is updated daily on week days.
Initial download of the metrics may take a while.