Free Access
Fig. 2
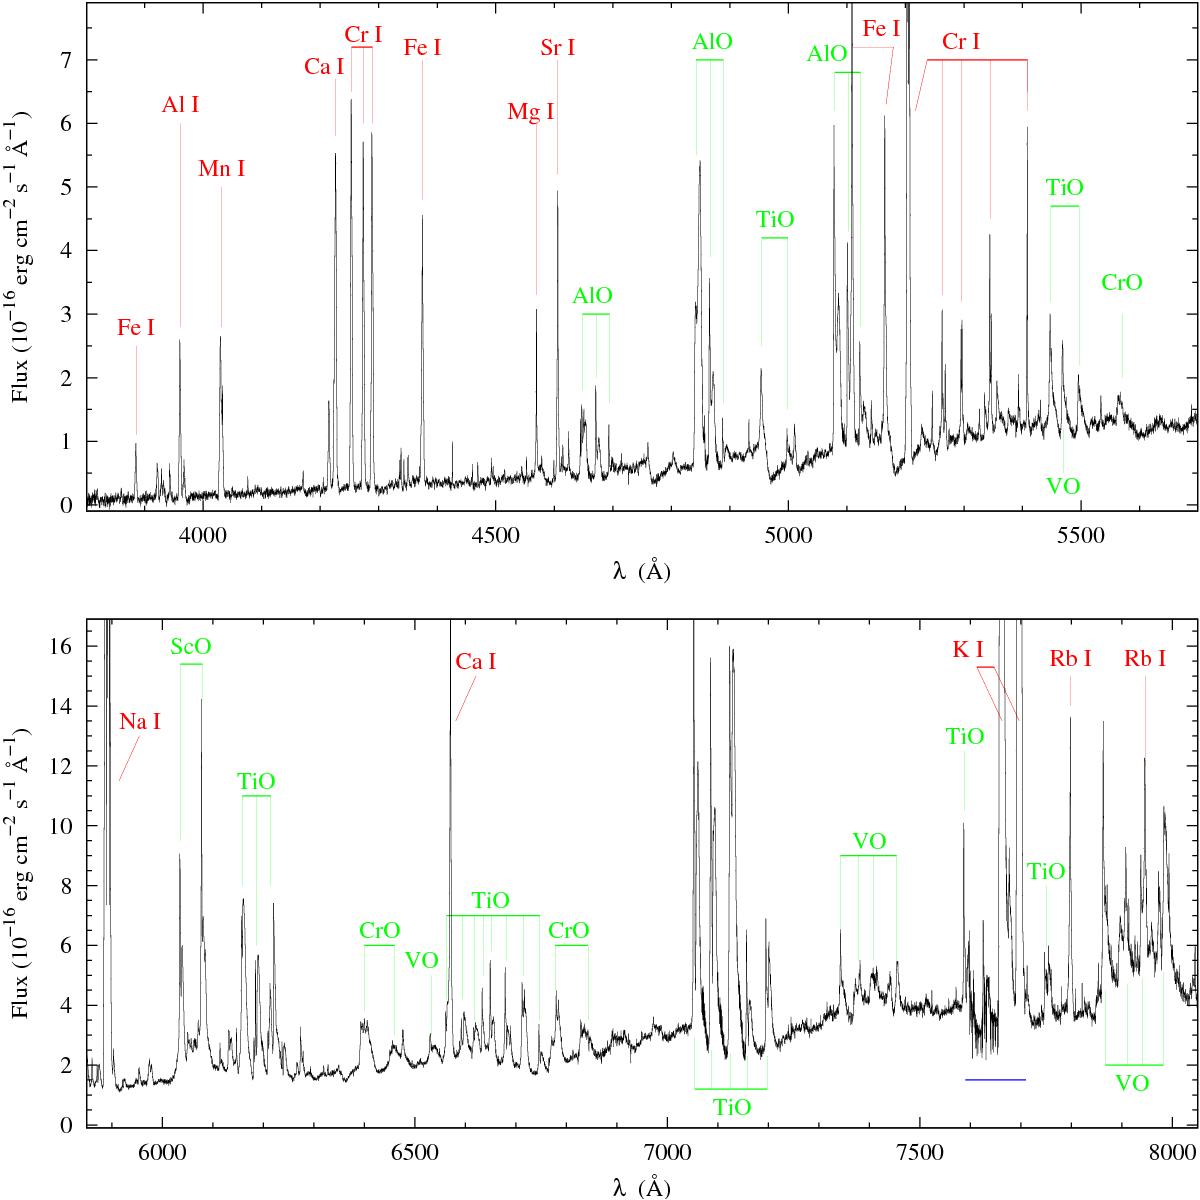
Spectrum of V4332 Sgr obtained in April–May 2005 with the UVES/VLT. The displayed spectrum was smoothed from the original resolution with boxcar 10. The strongest atomic (red) and molecular (green) spectral features are indicated. A blue horizontal bar indicates the spectral region affected by telluric absorption bands.
Current usage metrics show cumulative count of Article Views (full-text article views including HTML views, PDF and ePub downloads, according to the available data) and Abstracts Views on Vision4Press platform.
Data correspond to usage on the plateform after 2015. The current usage metrics is available 48-96 hours after online publication and is updated daily on week days.
Initial download of the metrics may take a while.