Free Access
Fig. 1
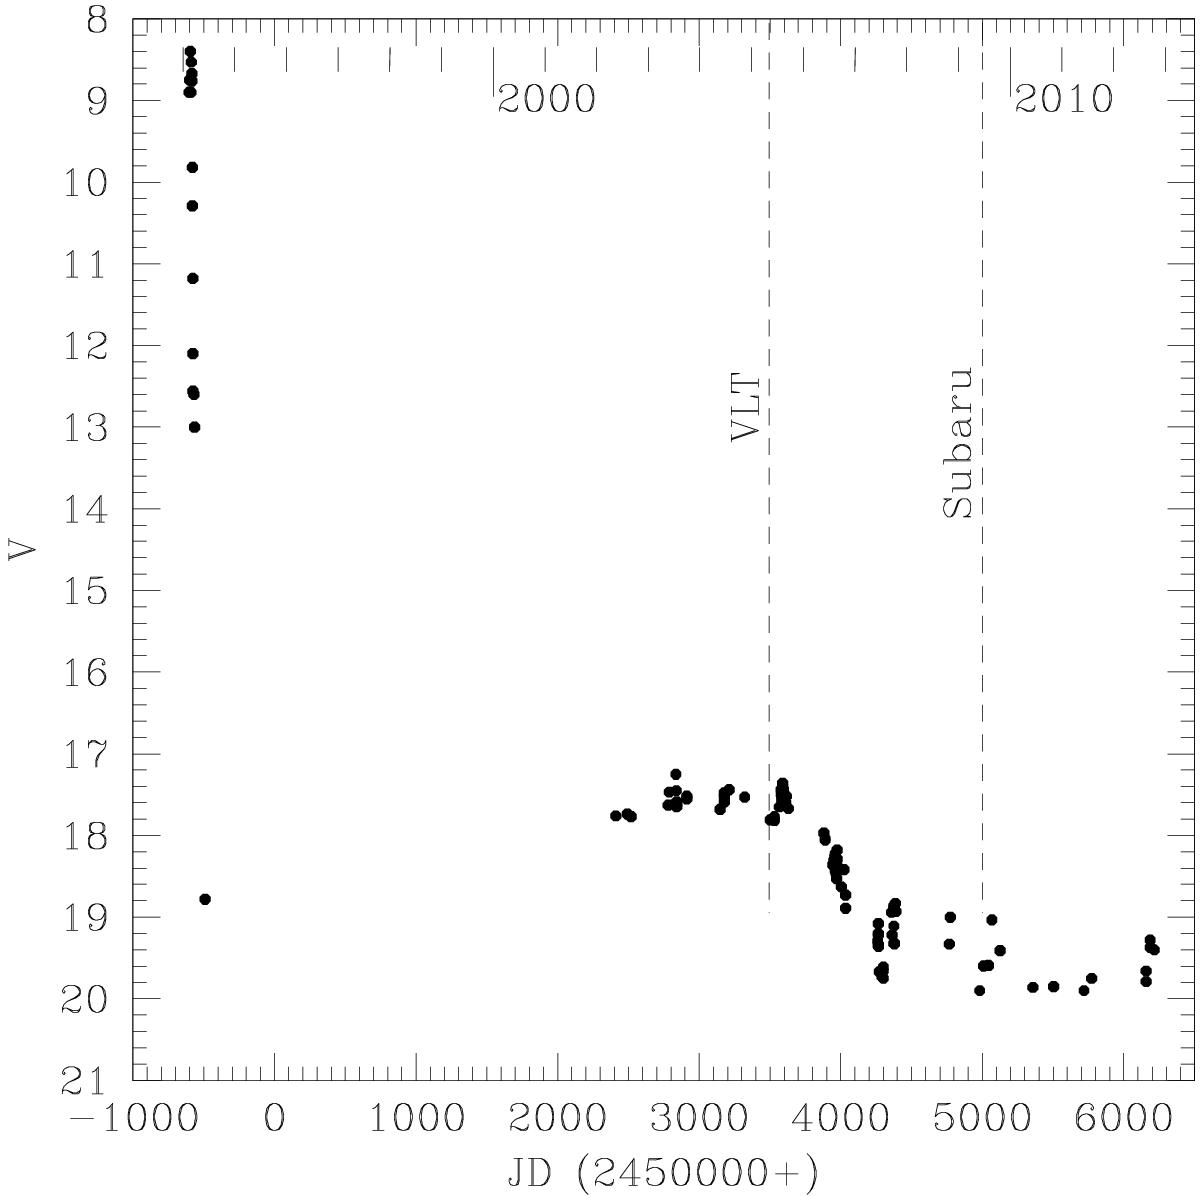
Light curve of V4332 Sgr in the V band. Vertical dashed lines indicate the time moments of the VLT spectroscopy we analysed and the observations obtained with the Subaru telescope in June 2009 that are described in Kamiński et al. (2010).
Current usage metrics show cumulative count of Article Views (full-text article views including HTML views, PDF and ePub downloads, according to the available data) and Abstracts Views on Vision4Press platform.
Data correspond to usage on the plateform after 2015. The current usage metrics is available 48-96 hours after online publication and is updated daily on week days.
Initial download of the metrics may take a while.