Fig. 5
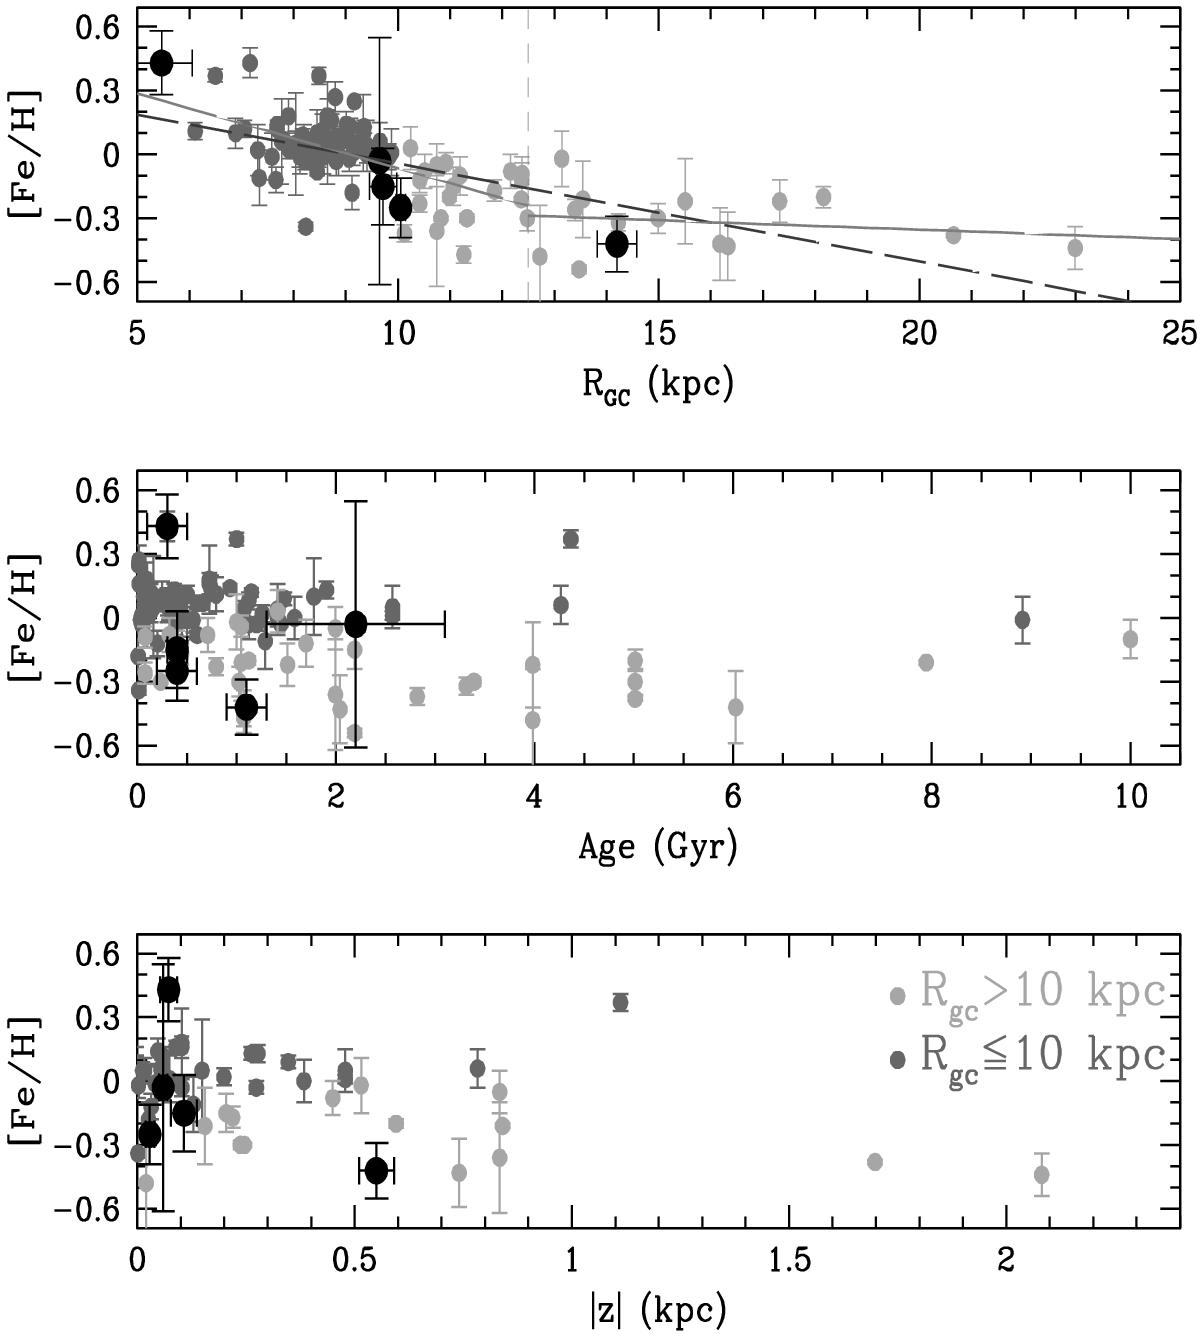
Gradient in [Fe/H] as a function of RGC (top), age (middle), and | z | (bottom) of the OCs in the Carrera & Pancino (2011) compilation. For the clusters studied here, we have used the weighted mean of the values obtained in the three bands listed in Col. 5 of Table 3. Dark and light grey points are clusters inside and outside radial distances of 10 kpc, respectively. Black points are the clusters studied in this paper. Solid lines in the top panel represent two separate linear fits obtained by Carrera & Pancino (2011) for OC inside and outside 12.5 kpc. The dashed line is the fit obtained by the same authors using all open clusters.
Current usage metrics show cumulative count of Article Views (full-text article views including HTML views, PDF and ePub downloads, according to the available data) and Abstracts Views on Vision4Press platform.
Data correspond to usage on the plateform after 2015. The current usage metrics is available 48-96 hours after online publication and is updated daily on week days.
Initial download of the metrics may take a while.