Fig. 8
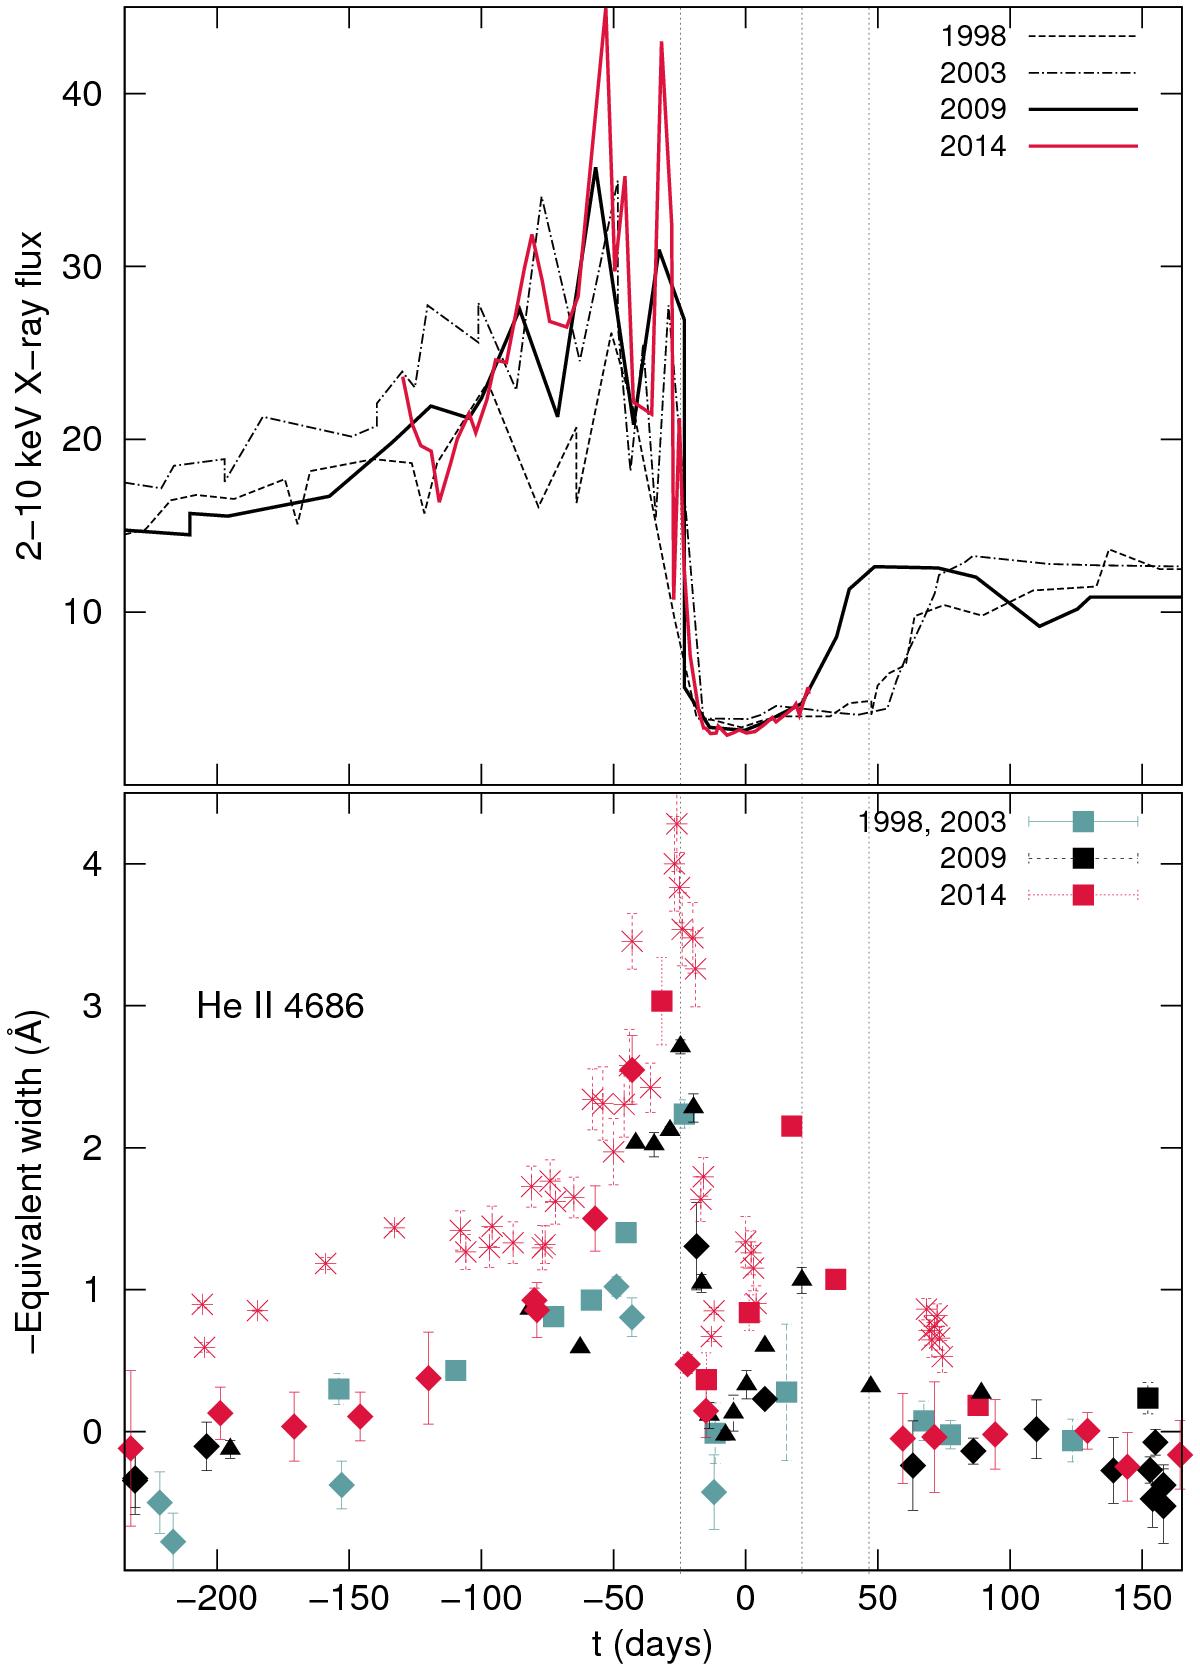
Top: schematic 2−10 keV X-ray light curve during the 1998−2014 events (Corcoran et al. 2014a)5. Bottom: the He ii equivalent widths for the same time span. The vertical lines are to aid the comparison of the decline and rise of the X-rays with the He ii maxima. Unfortunately, we have no data at the expected later phase of the second He ii flare for events prior to 2009.
Current usage metrics show cumulative count of Article Views (full-text article views including HTML views, PDF and ePub downloads, according to the available data) and Abstracts Views on Vision4Press platform.
Data correspond to usage on the plateform after 2015. The current usage metrics is available 48-96 hours after online publication and is updated daily on week days.
Initial download of the metrics may take a while.