Fig. 5
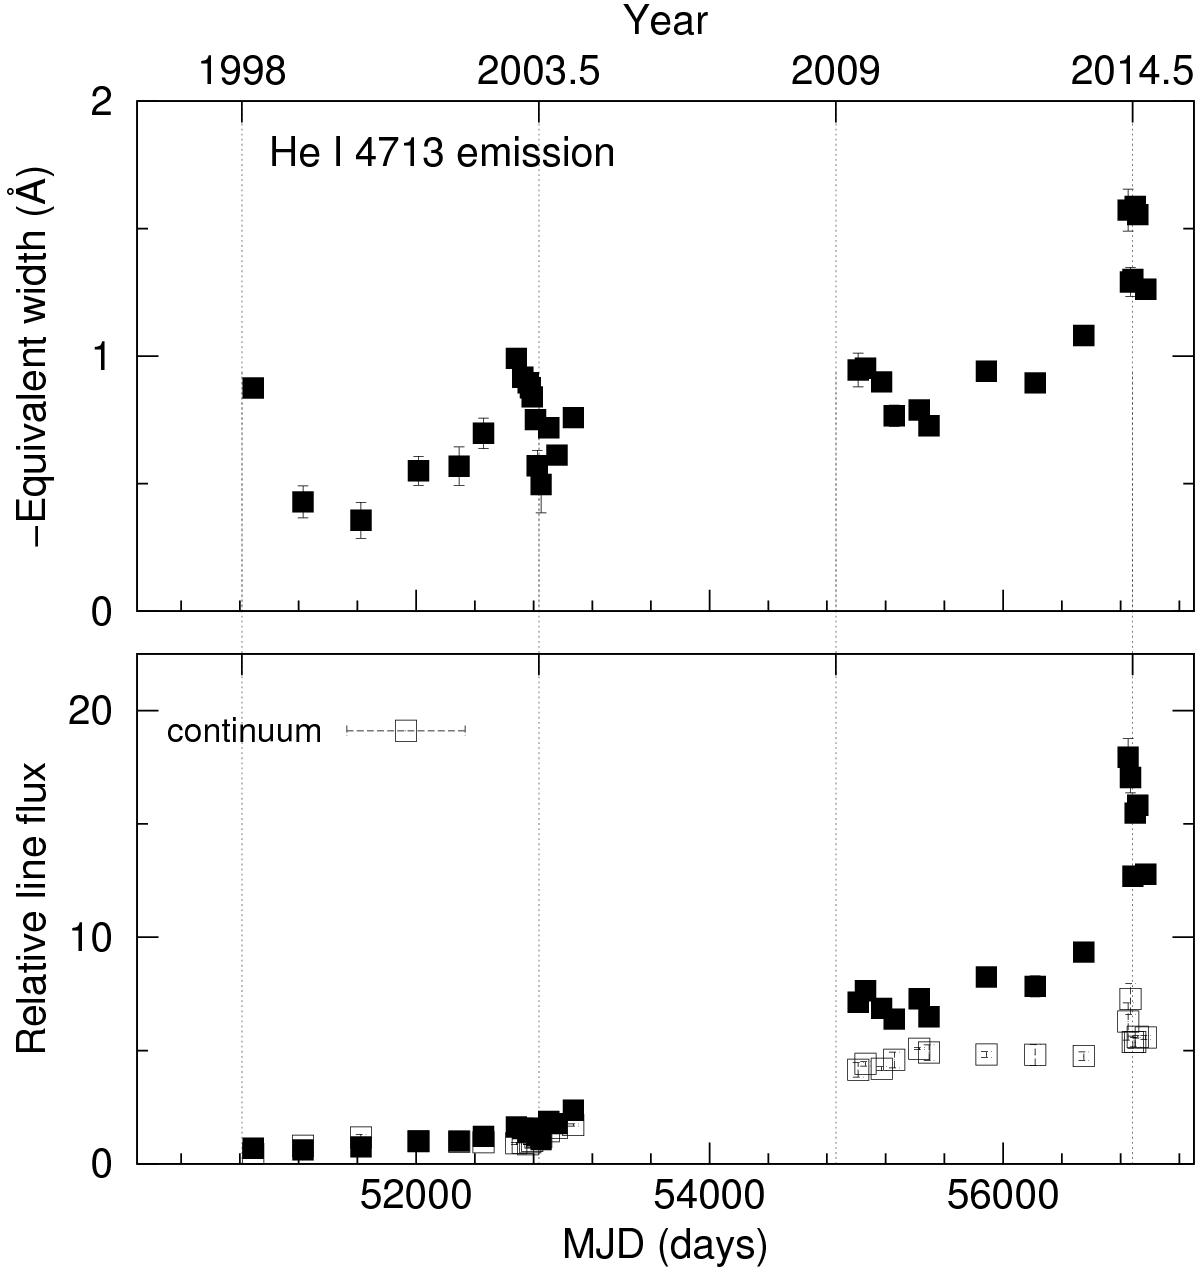
Equivalent width and relative line flux of the He i λ4713 emission in our direct line of sight in STIS data since 1998 March (filled squares). The line was integrated between ~4711.5 Å and 4721.5 Å (we varied the blue side of this range somewhat to exclude the absorption component) with a continuum interpolated between 4601−4611 Å and 4739−4742 Å. The open squares show the continuum variation between ~4711.5 Å and 4721.5 Å. Phases 0.0, 1.0, 2.0, and 3.0 are indicated with vertical lines. The relative line flux and continuum were normalized to unity at phase 0.6. The He i λ4713 line flux increased by more than a factor of ~8 in 2009−2014 compared to 1998−2003, while the continuum increased by a factor of ~5. During the 2014 event, the line became tremendously bright.
Current usage metrics show cumulative count of Article Views (full-text article views including HTML views, PDF and ePub downloads, according to the available data) and Abstracts Views on Vision4Press platform.
Data correspond to usage on the plateform after 2015. The current usage metrics is available 48-96 hours after online publication and is updated daily on week days.
Initial download of the metrics may take a while.