Fig. 13
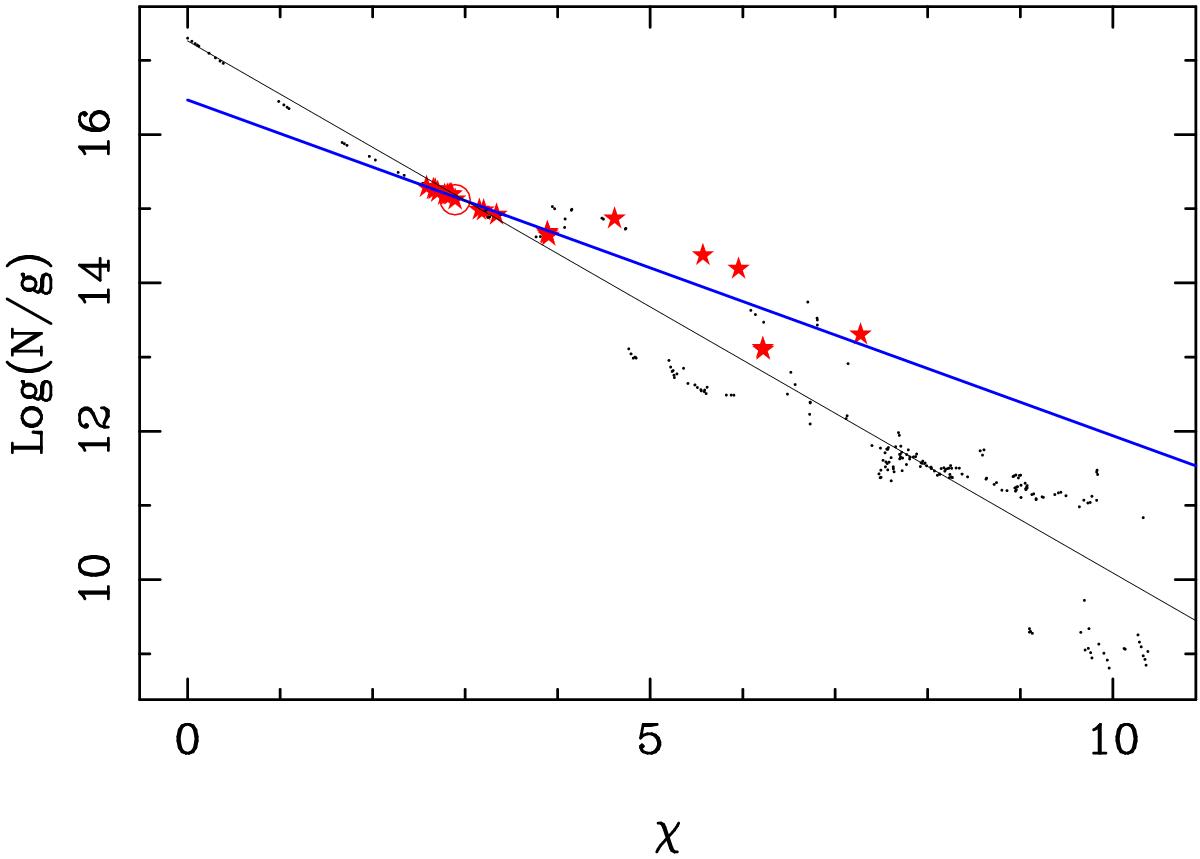
Theoretical “excitation temperatures” from column densities for Fe ii levels of the Cloudy models. The quantity g is the statistical weight, 2J + 1, of the levels. The larger symbols are for levels that correspond to the lines used in Fig. 12. The heavy line is a least squares solution giving T = 11 134 K. Smaller symbols are for all 256 levels used in the model; the lighter line corresponds to T = 7026 K.
Current usage metrics show cumulative count of Article Views (full-text article views including HTML views, PDF and ePub downloads, according to the available data) and Abstracts Views on Vision4Press platform.
Data correspond to usage on the plateform after 2015. The current usage metrics is available 48-96 hours after online publication and is updated daily on week days.
Initial download of the metrics may take a while.