Fig. 12
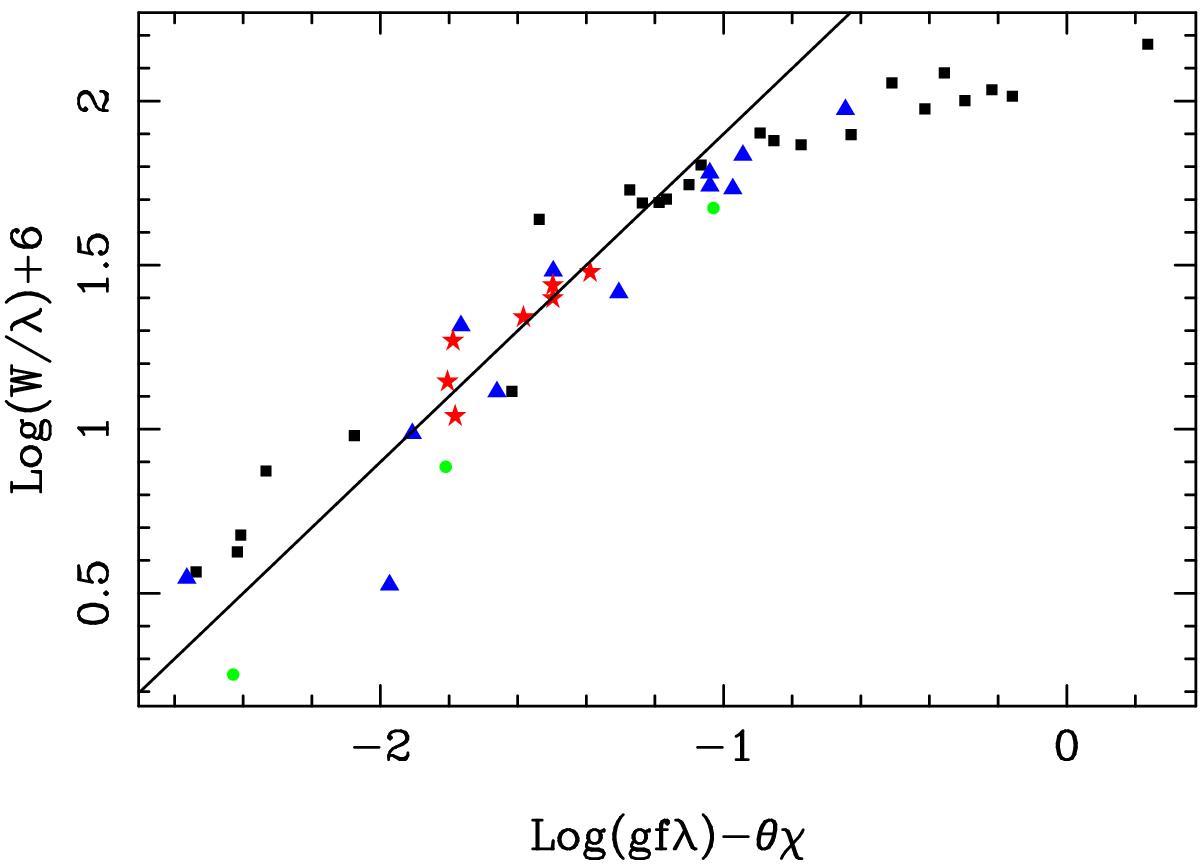
Excitation temperature from Fe ii lines in the shell. The (red) stars indicate lines with the highest lower excitation energies (6.2 to 7.3 eV). The lowest-excitation lines (2.6−2.9 eV) are indicated by black squares. The black line indicates a 45° slope. This plot was made with θ = 0.55 or T = 9164 K with an uncertainty of ~±170 K (see text). Colors may be seen online.
Current usage metrics show cumulative count of Article Views (full-text article views including HTML views, PDF and ePub downloads, according to the available data) and Abstracts Views on Vision4Press platform.
Data correspond to usage on the plateform after 2015. The current usage metrics is available 48-96 hours after online publication and is updated daily on week days.
Initial download of the metrics may take a while.