Fig. 4
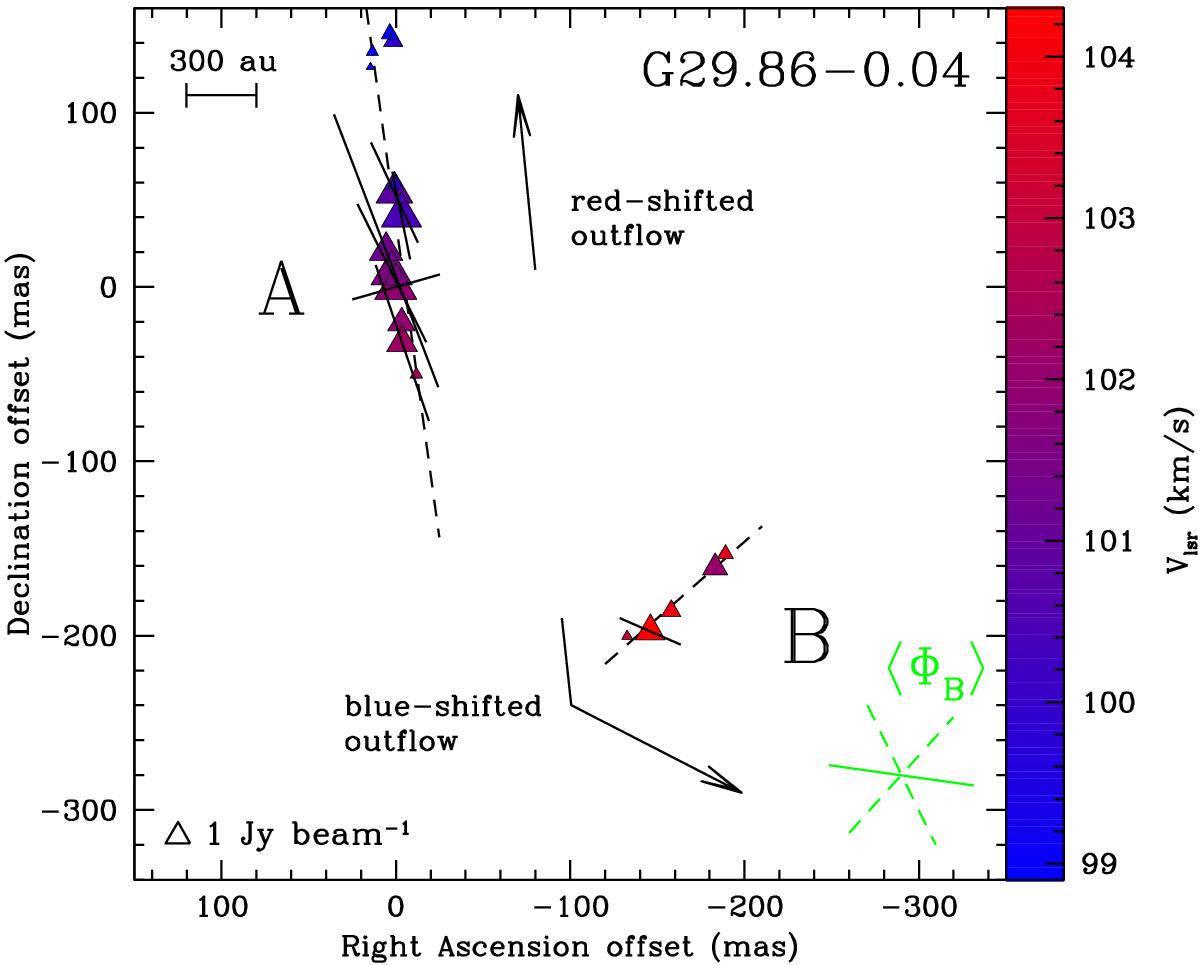
View of the CH3OH maser features detected around G29.86-0.04 (Table A.3). Same symbols as in Fig. 2. The assumed velocity of the massive SFR region is ![]() km s-1 (de Villiers et al. 2014). The two arrows indicate the direction, and not the actual position, of the red- and blueshifted lobe of the bipolar outflow (
km s-1 (de Villiers et al. 2014). The two arrows indicate the direction, and not the actual position, of the red- and blueshifted lobe of the bipolar outflow (![]() ° and
° and ![]() °; de Villiers et al. 2014). The dashed lines are the best linear fit to the positions of the CH3OH maser features of group A and B (
°; de Villiers et al. 2014). The dashed lines are the best linear fit to the positions of the CH3OH maser features of group A and B (![]() ° and
° and ![]() °).
°).
Current usage metrics show cumulative count of Article Views (full-text article views including HTML views, PDF and ePub downloads, according to the available data) and Abstracts Views on Vision4Press platform.
Data correspond to usage on the plateform after 2015. The current usage metrics is available 48-96 hours after online publication and is updated daily on week days.
Initial download of the metrics may take a while.