Fig. 2
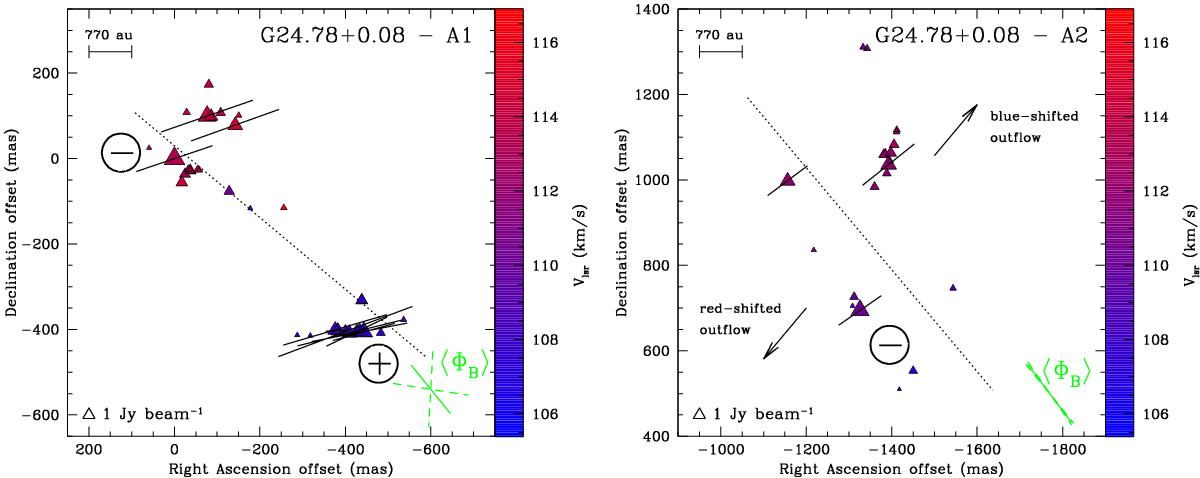
View of the CH3OH maser features detected around the mm subcores A1 (left panel) and A2 (right panel) of G24.78+0.08. The reference position is ![]() and
and ![]() (see Sect. 3). Triangle symbols identify CH3OH maser features scaled logarithmically according to their peak flux density (Table A.1). Maser LSR radial velocities are indicated by color (the assumed velocity of the region is
(see Sect. 3). Triangle symbols identify CH3OH maser features scaled logarithmically according to their peak flux density (Table A.1). Maser LSR radial velocities are indicated by color (the assumed velocity of the region is ![]() km s-1, Furuya et al. 2002). A 1 Jy beam-1 symbol is plotted for illustration in both panels. The linear polarization vectors, scaled logarithmically according to polarization fraction Pl, are overplotted. In the bottom right corner of both panels the corresponding error-weighted orientation of the magnetic field (⟨ ΦB ⟩, see Sect. 5.1) is also reported, the two dashed segments indicate the uncertainty. The two arrows in the right panel indicate the direction, and not the actual position, of the red- and blueshifted lobes of the
km s-1, Furuya et al. 2002). A 1 Jy beam-1 symbol is plotted for illustration in both panels. The linear polarization vectors, scaled logarithmically according to polarization fraction Pl, are overplotted. In the bottom right corner of both panels the corresponding error-weighted orientation of the magnetic field (⟨ ΦB ⟩, see Sect. 5.1) is also reported, the two dashed segments indicate the uncertainty. The two arrows in the right panel indicate the direction, and not the actual position, of the red- and blueshifted lobes of the ![]() outflow associated with G24.78+0.08-A2 (
outflow associated with G24.78+0.08-A2 (![]() °; Beltrán et al. 2011). The dotted lines indicate the direction of the CH3CN toroids (Beltrán et al. 2011). The circled plus and minus symbols indicate where the magnetic field points away from and where toward the observer, respectively.
°; Beltrán et al. 2011). The dotted lines indicate the direction of the CH3CN toroids (Beltrán et al. 2011). The circled plus and minus symbols indicate where the magnetic field points away from and where toward the observer, respectively.
Current usage metrics show cumulative count of Article Views (full-text article views including HTML views, PDF and ePub downloads, according to the available data) and Abstracts Views on Vision4Press platform.
Data correspond to usage on the plateform after 2015. The current usage metrics is available 48-96 hours after online publication and is updated daily on week days.
Initial download of the metrics may take a while.