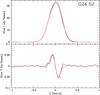
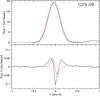
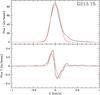
Fig. 1
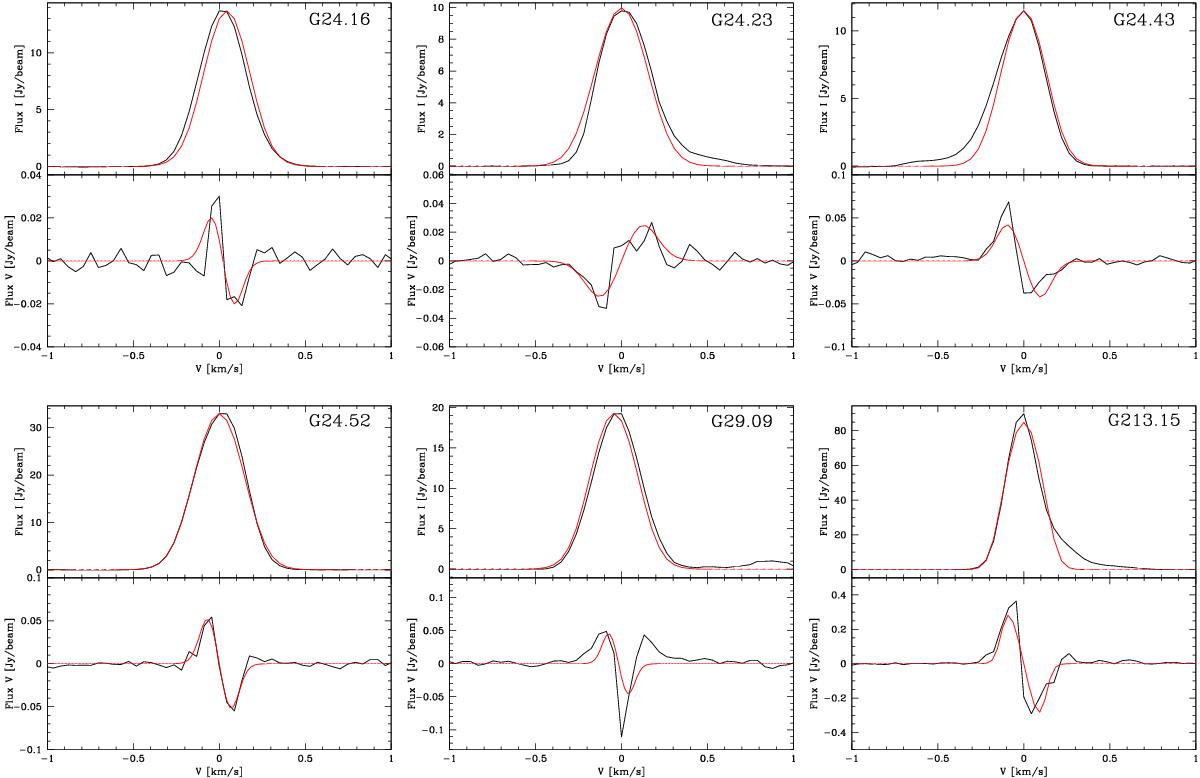
Total intensity (I, upper panel) and circularly polarized intensity (V, lower panel) spectra for the CH3OH maser features G24.16, G24.23, G24.43, G24.52, G29.09, and G213.15 (see Tables A.1, A.3, and A.7). The thick red lines are the best-fit models of I and V emission obtained using the adapted FRTM code (see Sect. 3). The maser features were centered on zero velocity.
Current usage metrics show cumulative count of Article Views (full-text article views including HTML views, PDF and ePub downloads, according to the available data) and Abstracts Views on Vision4Press platform.
Data correspond to usage on the plateform after 2015. The current usage metrics is available 48-96 hours after online publication and is updated daily on week days.
Initial download of the metrics may take a while.