Fig. 5
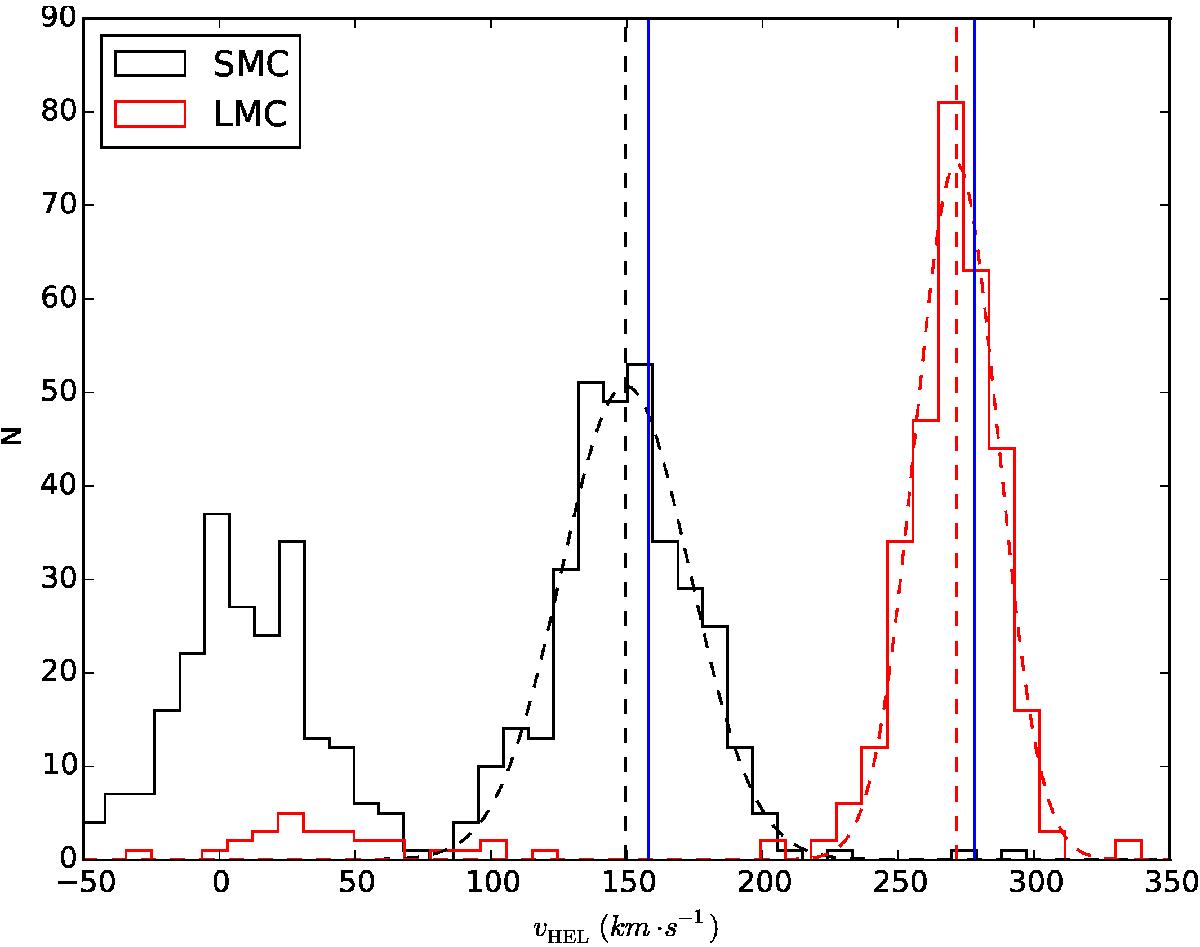
Observed heliocentric velocities for all the sources in the LMC (red) and SMC (black). Overplotted with dashed lines are Gaussian fits to the distributions, and their μ is marked with a vertical dashed lines. For comparison, the blue vertical lines denote the systemic velocities for the clouds (taken from Massey & Olsen 2003).
Current usage metrics show cumulative count of Article Views (full-text article views including HTML views, PDF and ePub downloads, according to the available data) and Abstracts Views on Vision4Press platform.
Data correspond to usage on the plateform after 2015. The current usage metrics is available 48-96 hours after online publication and is updated daily on week days.
Initial download of the metrics may take a while.