Free Access
Fig. 3
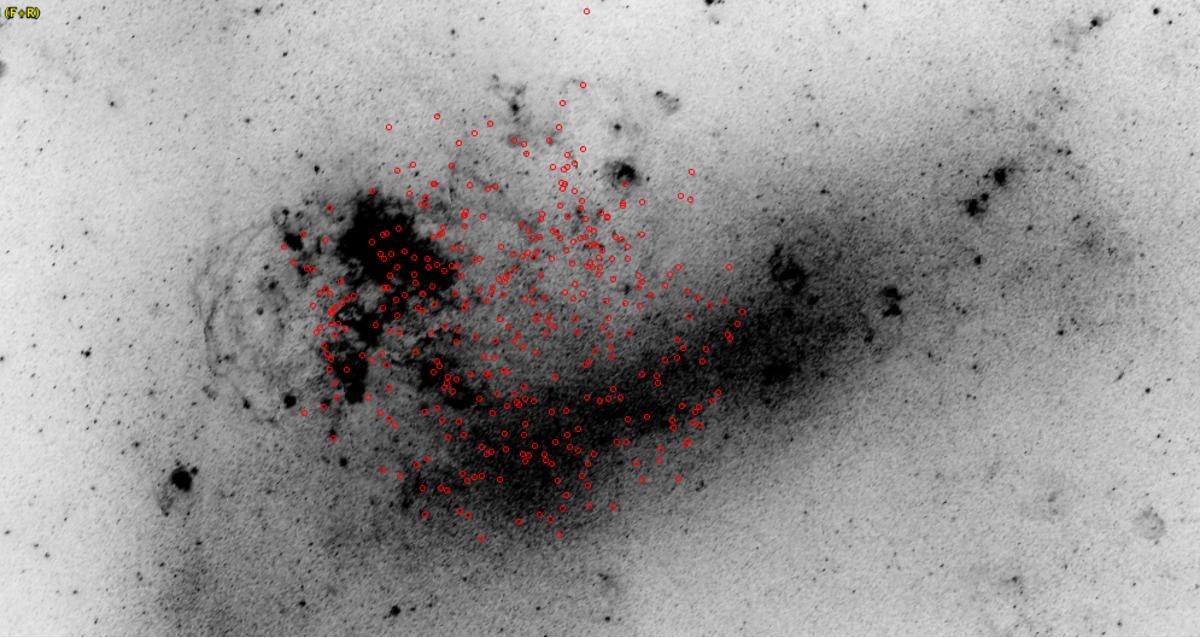
Spatial distribution of targets in the LMC, over a DSS-Red image roughly 4° × 2° in size. As can be seen, all the targets (from a single AAOmega pointing) are distributed over a region that covers less than 50% of this galaxy.
Current usage metrics show cumulative count of Article Views (full-text article views including HTML views, PDF and ePub downloads, according to the available data) and Abstracts Views on Vision4Press platform.
Data correspond to usage on the plateform after 2015. The current usage metrics is available 48-96 hours after online publication and is updated daily on week days.
Initial download of the metrics may take a while.