Free Access
Fig. 15
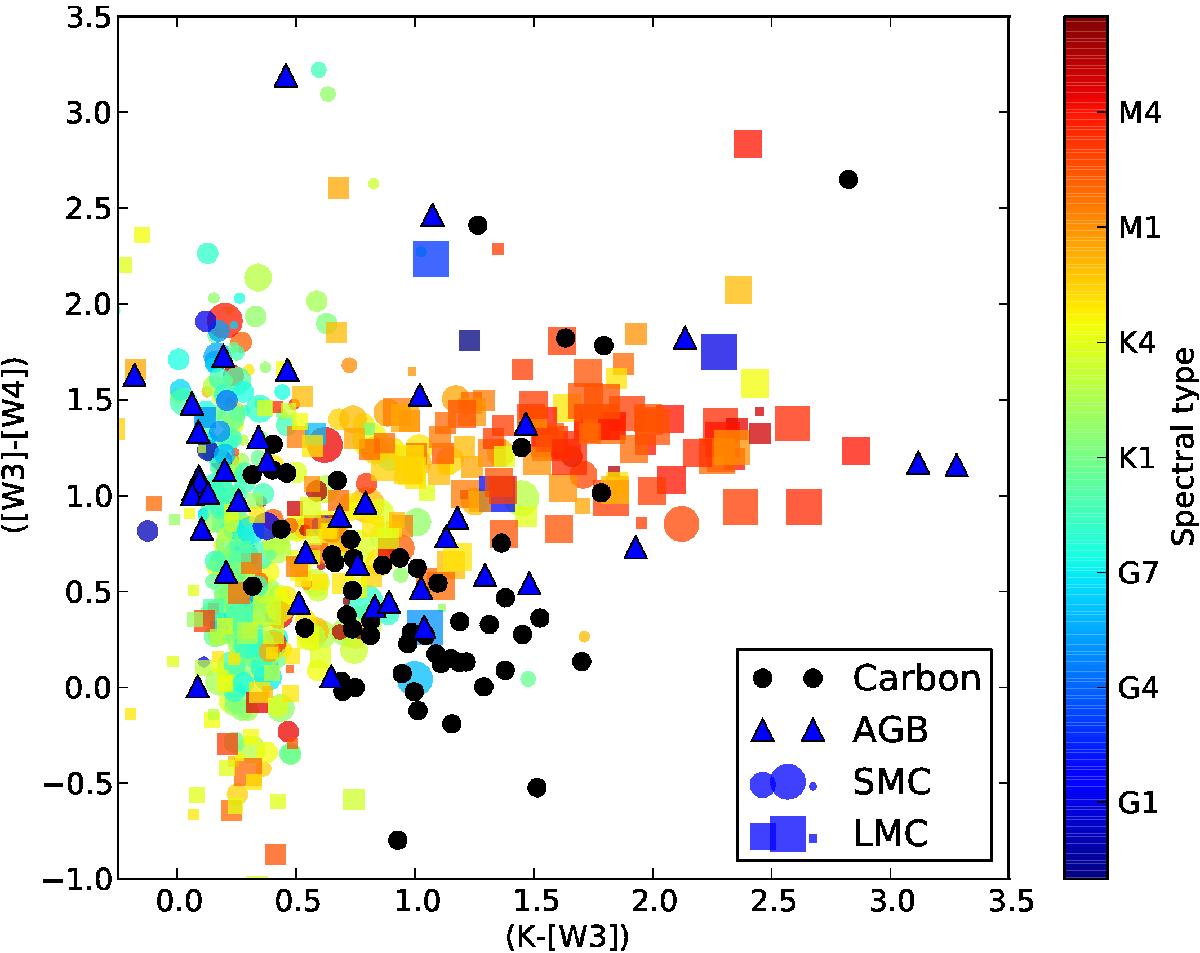
Colour−colour diagram for our sample of MC stars, representing (KS − [ W3 ]) (related to mass loss) vs. ([ W3 ] − [ W4 ]), related to the temperature of the outer dust layers. In this plot, symbol size is a function of LC (i.e. larger symbols imply brighter classes).
Current usage metrics show cumulative count of Article Views (full-text article views including HTML views, PDF and ePub downloads, according to the available data) and Abstracts Views on Vision4Press platform.
Data correspond to usage on the plateform after 2015. The current usage metrics is available 48-96 hours after online publication and is updated daily on week days.
Initial download of the metrics may take a while.