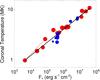
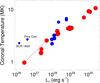
Fig. 3
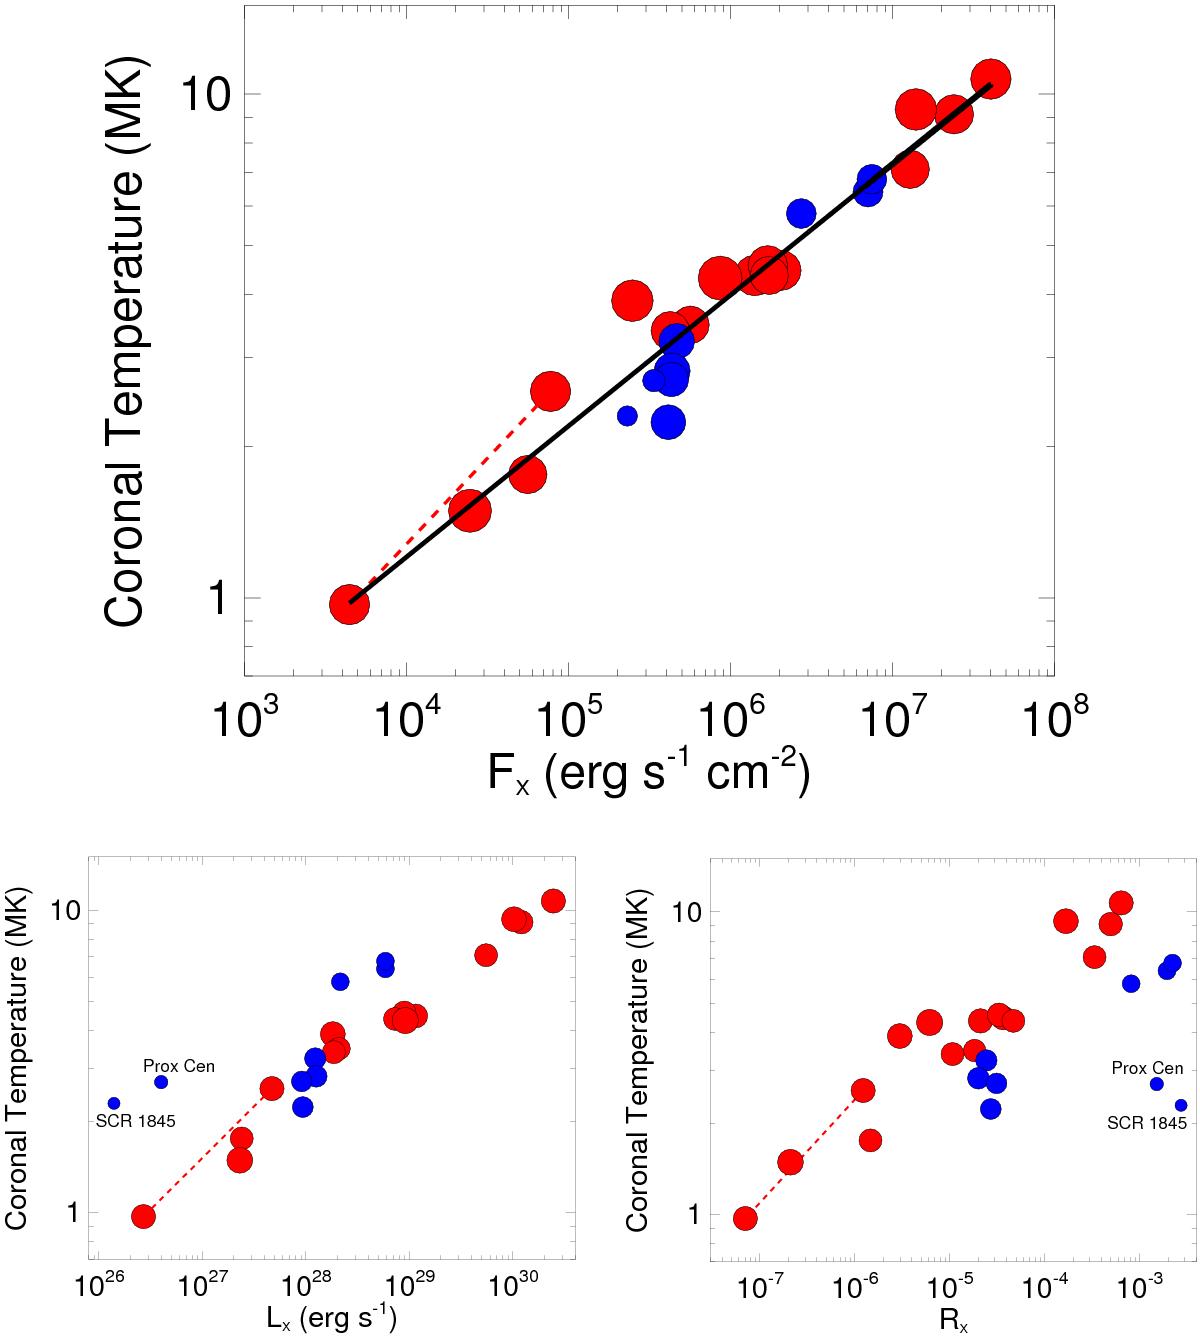
Average coronal temperature against FX (upper panel), LX (lower-left panel), and RX (lower-right panel), for a sample of low-mass main-sequence stars. As in Fig. 1, blue and red represent stars with masses below and above 0.65 M⊙ respectively. The black line in the upper panel shows the relation ![]() , where
, where ![]() is in MK and FX is in erg s-1. The two data points connected by the dashed line show the Sun at cycle minimum and cycle maximum. The values and references for these stars are listed in Table 1.
is in MK and FX is in erg s-1. The two data points connected by the dashed line show the Sun at cycle minimum and cycle maximum. The values and references for these stars are listed in Table 1.
Current usage metrics show cumulative count of Article Views (full-text article views including HTML views, PDF and ePub downloads, according to the available data) and Abstracts Views on Vision4Press platform.
Data correspond to usage on the plateform after 2015. The current usage metrics is available 48-96 hours after online publication and is updated daily on week days.
Initial download of the metrics may take a while.