Fig. 2
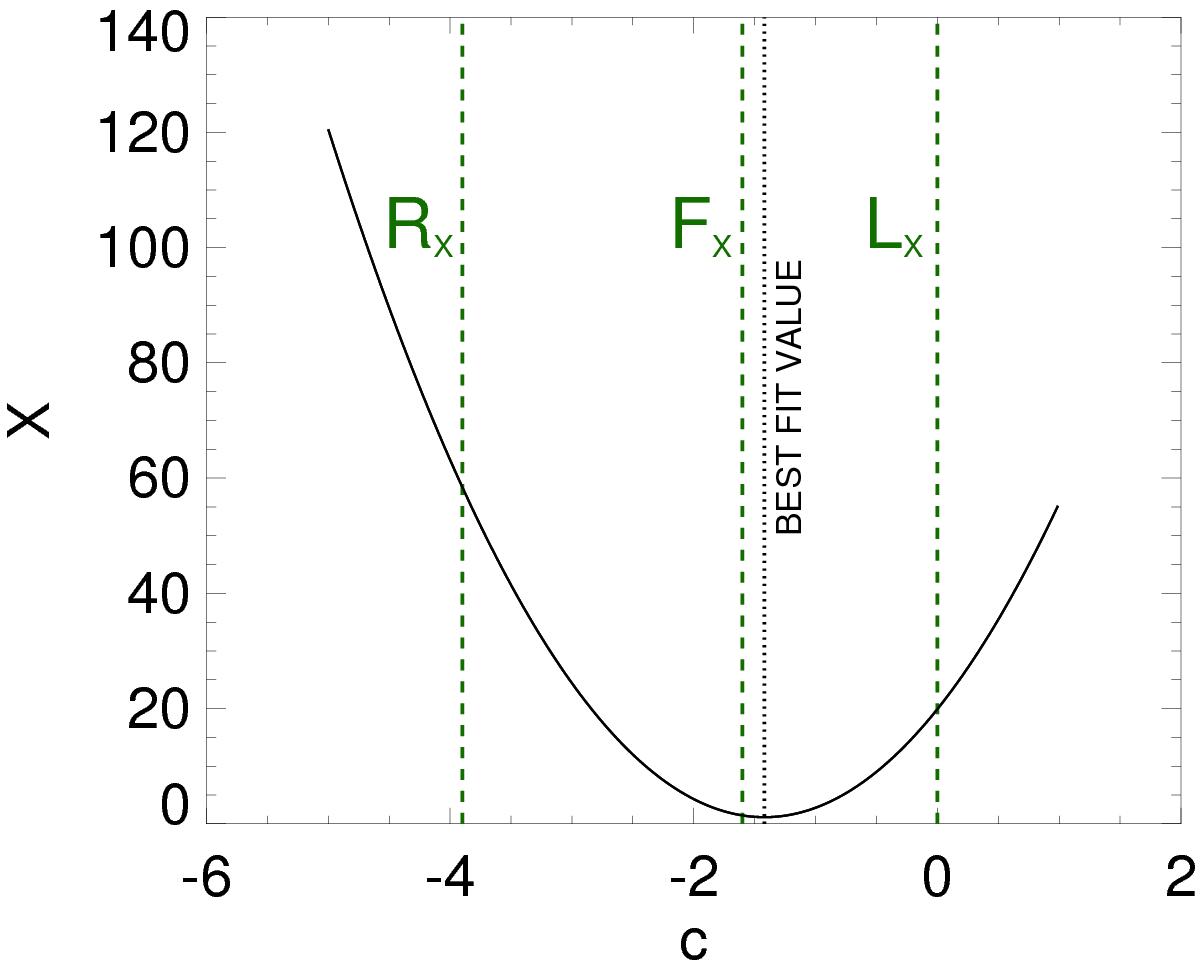
Best fit parameter, X, against the fit parameter c. For each value of c, we fit Eq. (2) to the sample of stars given in Table 1 and calculate X from Eq. (3). The three vertical dashed lines show the value of c that correspond to the different measure of X-ray emission and the dotted vertical line shows our best fit value of c.
Current usage metrics show cumulative count of Article Views (full-text article views including HTML views, PDF and ePub downloads, according to the available data) and Abstracts Views on Vision4Press platform.
Data correspond to usage on the plateform after 2015. The current usage metrics is available 48-96 hours after online publication and is updated daily on week days.
Initial download of the metrics may take a while.