Fig. 7
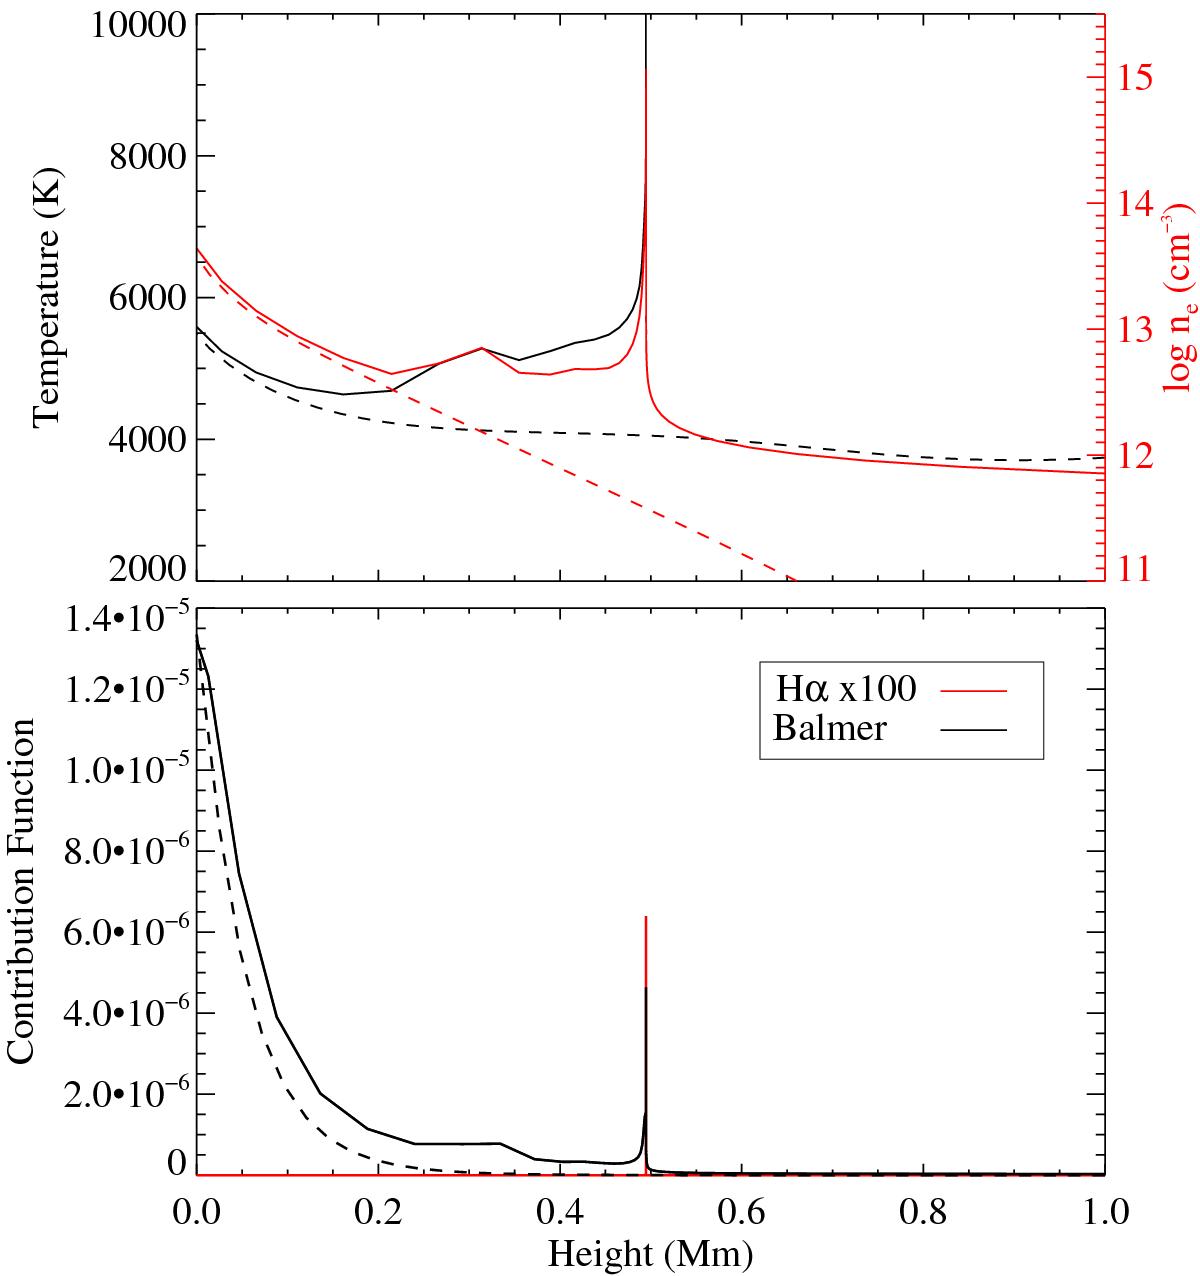
Top panel: structure of the lower atmopshere at 110 s into the flare simulation. Solid black and red lines display the temperature and electron density. The dashed lines display the original atmosphere at t = 0 s. Bottom panel: contribution function for the Balmer continuum at 3646 Å and for H α at line centre (6564.7 Å) for a viewing angle of μ = 1. The H α function was scaled by a factor of 100 to be visible on the same scale. The dashed black line displays the inital contributon function for the continuum at t = 0 s.
Current usage metrics show cumulative count of Article Views (full-text article views including HTML views, PDF and ePub downloads, according to the available data) and Abstracts Views on Vision4Press platform.
Data correspond to usage on the plateform after 2015. The current usage metrics is available 48-96 hours after online publication and is updated daily on week days.
Initial download of the metrics may take a while.