Fig. 6
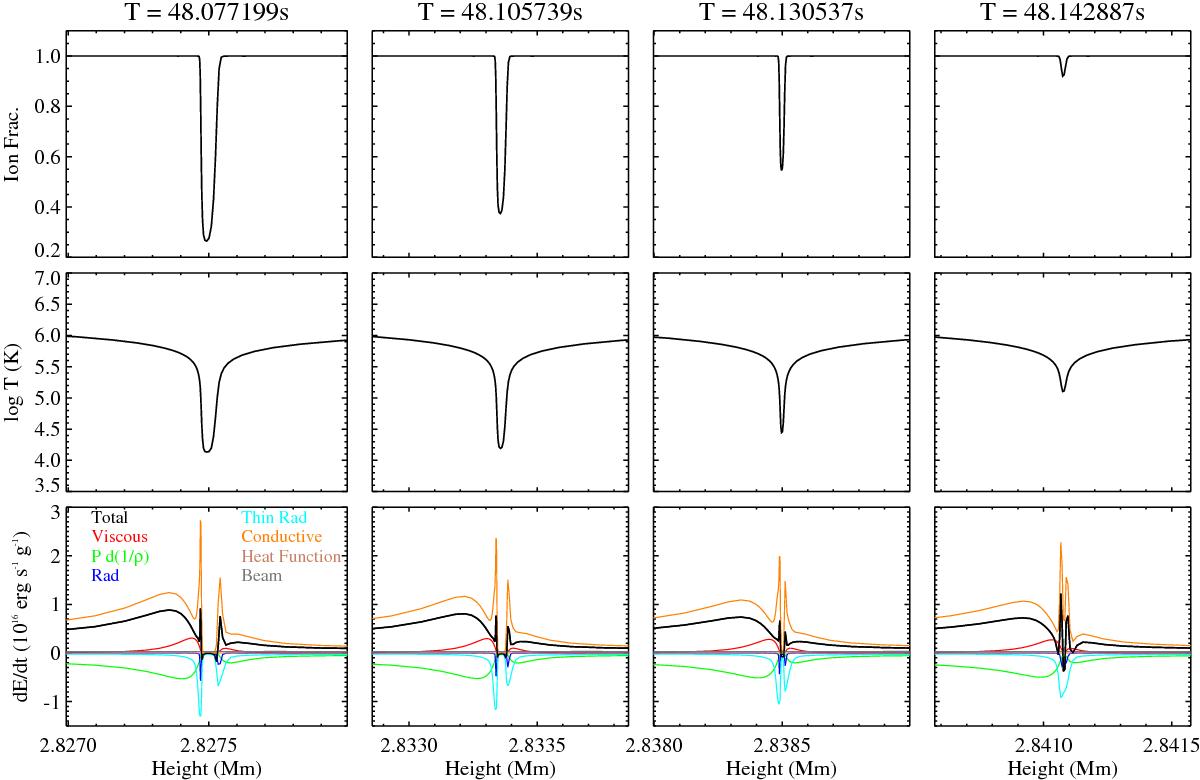
Top panels: ionisation fraction of He III from 48.07 to 48.14 s. Time is increasing from the left to right side of the plots. Middle panels: temperature of the atmosphere. Bottom panels: energy balance of the atmosphere. The quantities displayed are the net energy gain (black), viscous heating (red), work done by pressure (green), radiative losses from transitions solved in radiative transfer (blue), optically thin losses (cyan), conduction (orange), the background-heating function (brown), and the energy input from beam electrons (grey).
Current usage metrics show cumulative count of Article Views (full-text article views including HTML views, PDF and ePub downloads, according to the available data) and Abstracts Views on Vision4Press platform.
Data correspond to usage on the plateform after 2015. The current usage metrics is available 48-96 hours after online publication and is updated daily on week days.
Initial download of the metrics may take a while.