Fig. 5
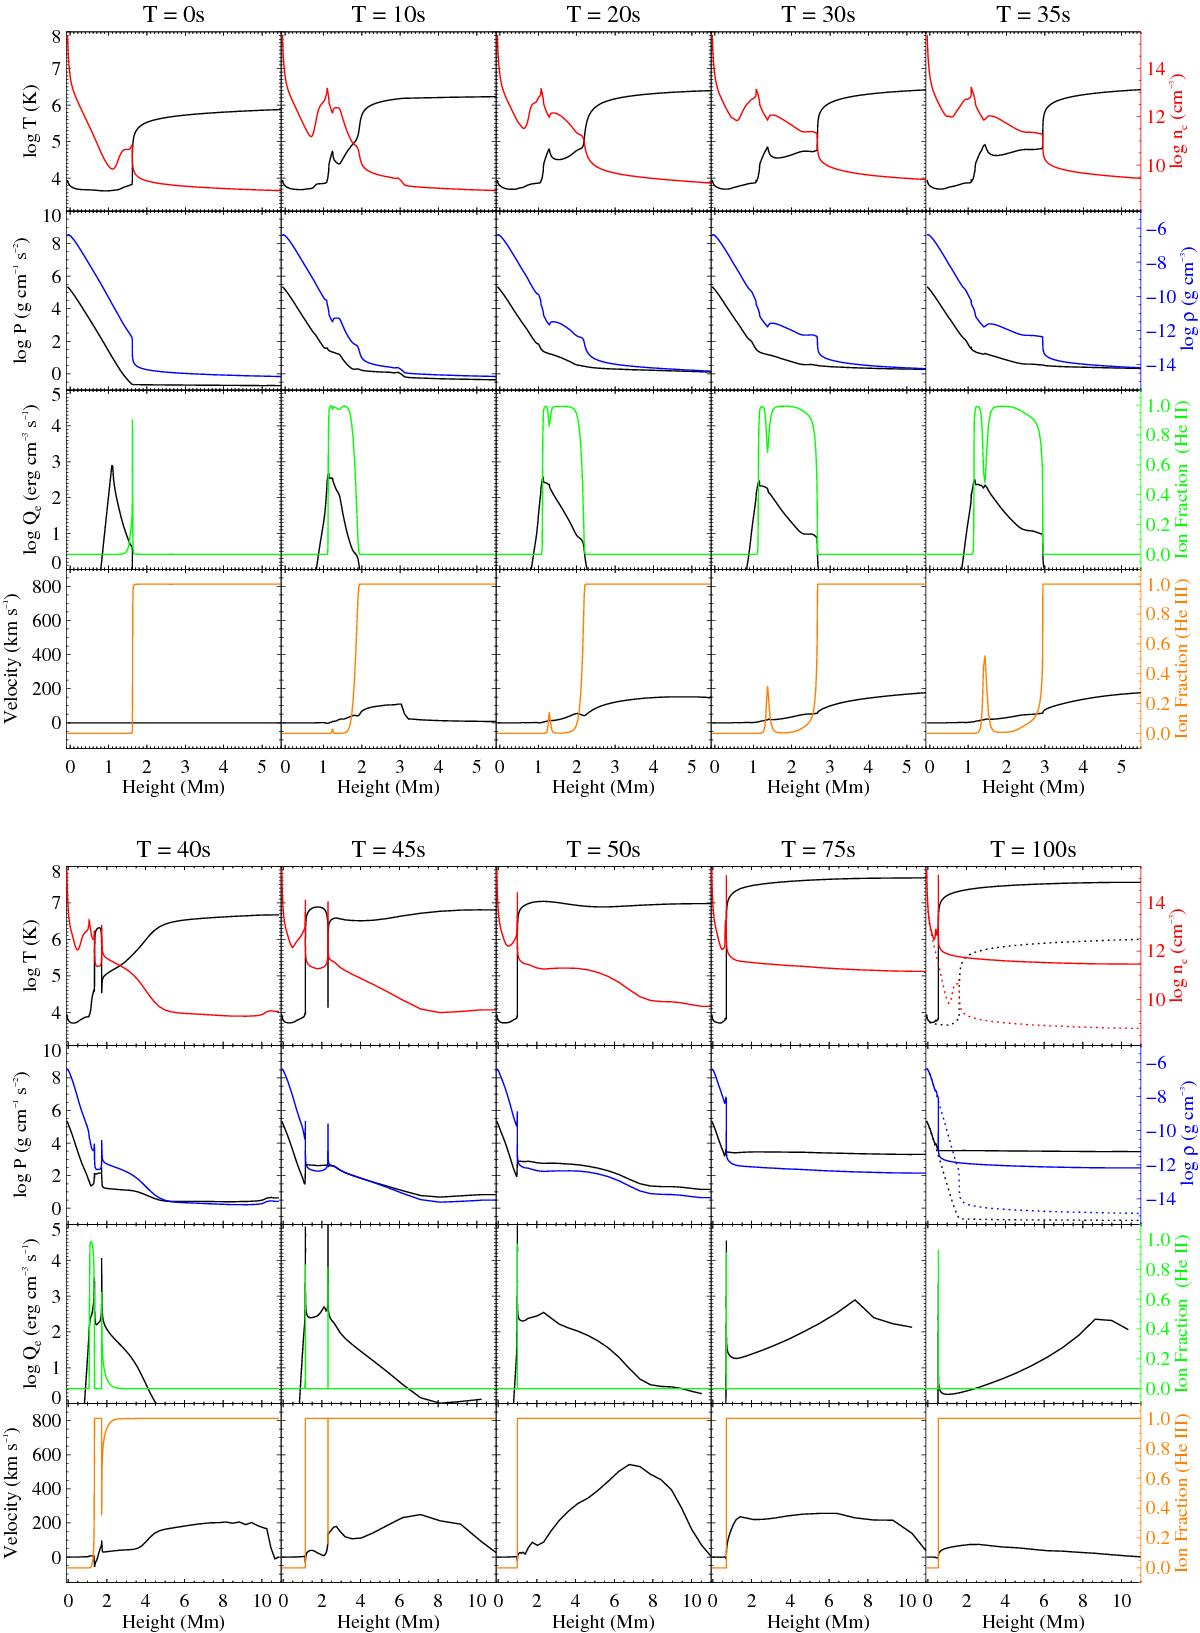
Structure and evolution of the simulated solar atmosphere. The top panels display the atmosphere in the early phase when the beam-heating rate is low. The bottom panels show the evolution of the atmosphere during the explosive phase. The temperature (black) and electron density (red) are shown in the top row. The second row shows the pressure (black) and mass density (blue). The third row displays the beam-heating rate (black) and ionisation fractions of He II (green). The bulk velocity of the atmosphere (black) and ionisation fraction of He III (orange) are shown in the bottom row. The original atmosphere is overplotted as dotted lines at T = 100 s to illustrate the change in atmospheric structure.
Current usage metrics show cumulative count of Article Views (full-text article views including HTML views, PDF and ePub downloads, according to the available data) and Abstracts Views on Vision4Press platform.
Data correspond to usage on the plateform after 2015. The current usage metrics is available 48-96 hours after online publication and is updated daily on week days.
Initial download of the metrics may take a while.