Fig. 4
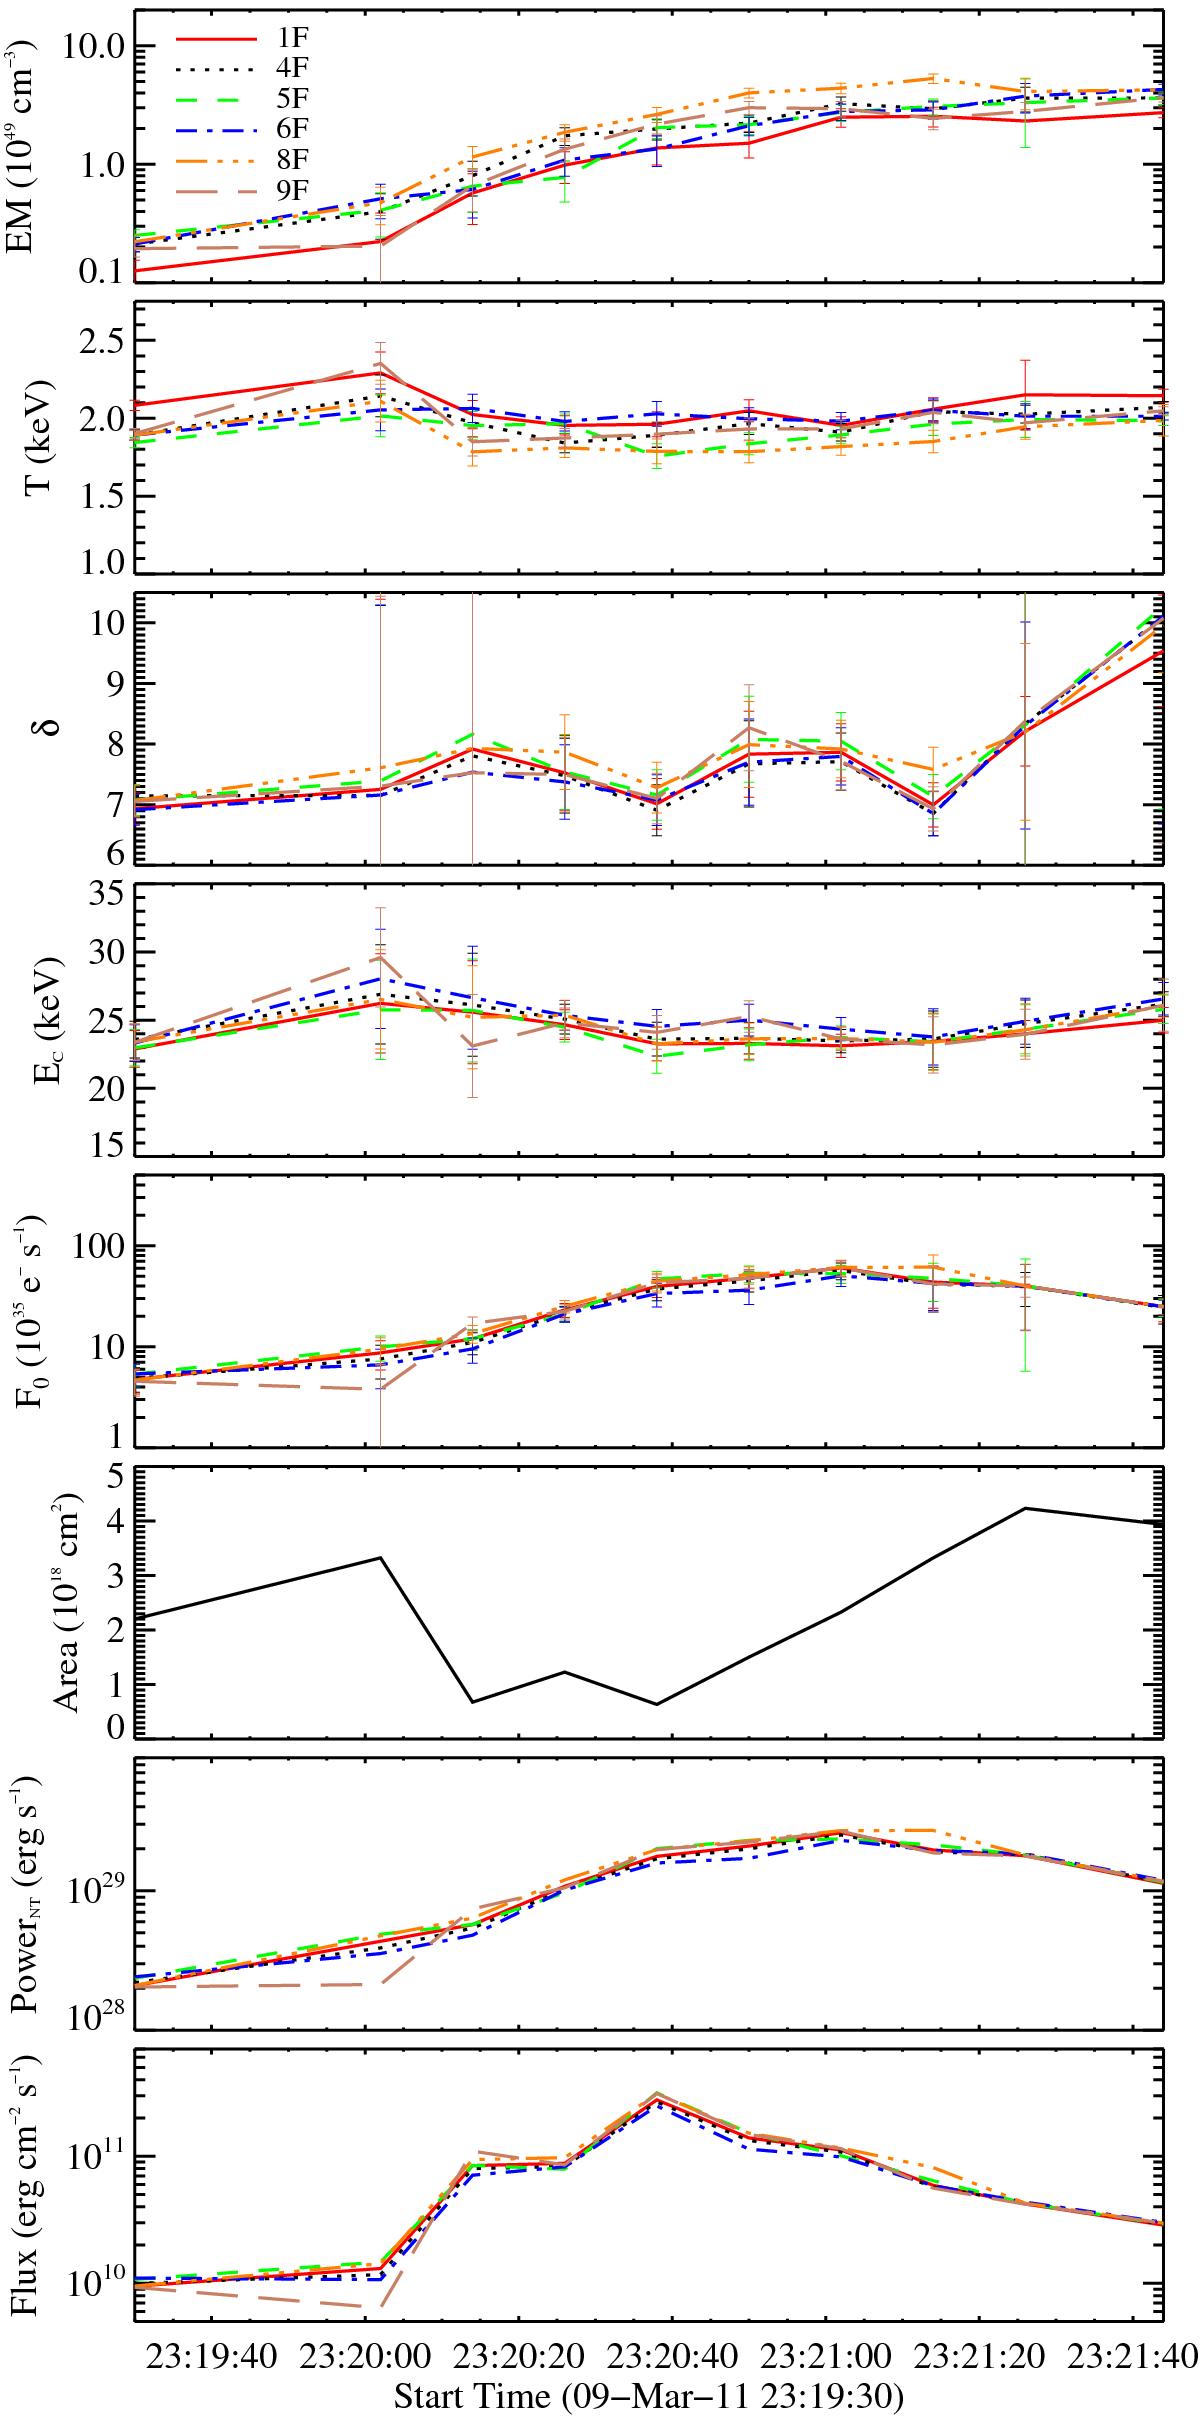
Evolution of the electron beam parameters determined from HXR spectral analysis. The quantities plotted from top to bottom are the emission measure, temperature, spectral index, low energy cut-off, total electron flux, estimated source area, power in non-thermal electrons above the cutoff, and the derived energy deposition rate into the atmosphere. The parameters from detector 1 are plotted as a solid line (red), detector 4 as a dotted line (black), detector 5 as a dashed line (green), detector 6 as a dash-dot-dash line (blue), detector 8 as a dash-dotted line (yellow), and detector 9 as a long dashed line (brown).
Current usage metrics show cumulative count of Article Views (full-text article views including HTML views, PDF and ePub downloads, according to the available data) and Abstracts Views on Vision4Press platform.
Data correspond to usage on the plateform after 2015. The current usage metrics is available 48-96 hours after online publication and is updated daily on week days.
Initial download of the metrics may take a while.