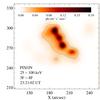
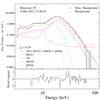
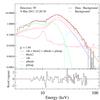
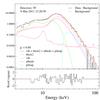
Fig. 2
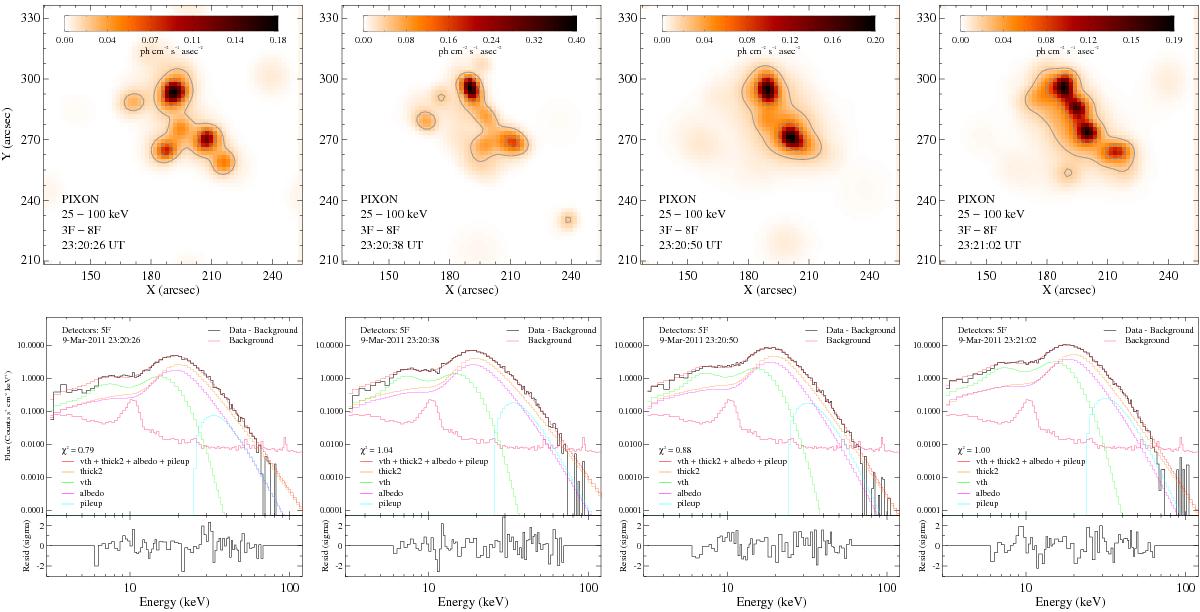
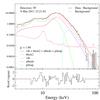
Top row: RHESSI imaging of the flare on 2011 March 09 over the time range UT 23:20:20−23:21:08. Images were created over the energy range 25.0−100.0 keV using the Pixon algorithm with an integration time of 12 s and detectors 3F−8F. The applied colour scaling is based on the highest and lowest data values present in the images displayed. Overplotted in grey are the 10% and 30% intensity contours. Bottom row: spectral fits in count flux units made during the same intervals.The background-subtracted data are plotted in black with the background level plotted in pink. The total fit is plotted in red along with the thermal component (green), the thick-target component (orange), albedo component (purple), and pulse pileup correction (cyan). The normalised residuals are shown in each plot in units of sigma.
Current usage metrics show cumulative count of Article Views (full-text article views including HTML views, PDF and ePub downloads, according to the available data) and Abstracts Views on Vision4Press platform.
Data correspond to usage on the plateform after 2015. The current usage metrics is available 48-96 hours after online publication and is updated daily on week days.
Initial download of the metrics may take a while.